

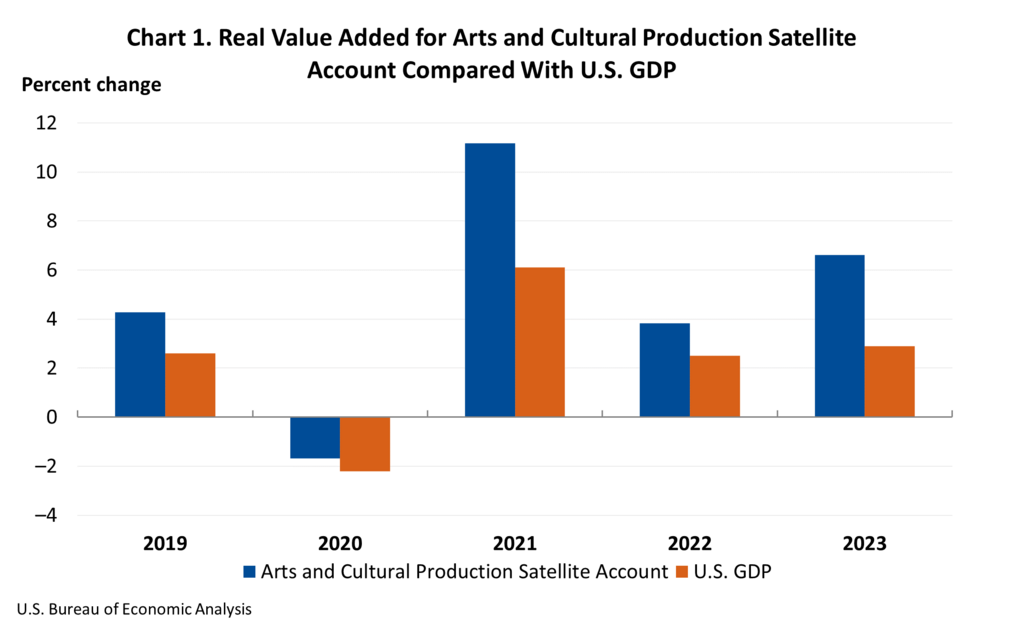
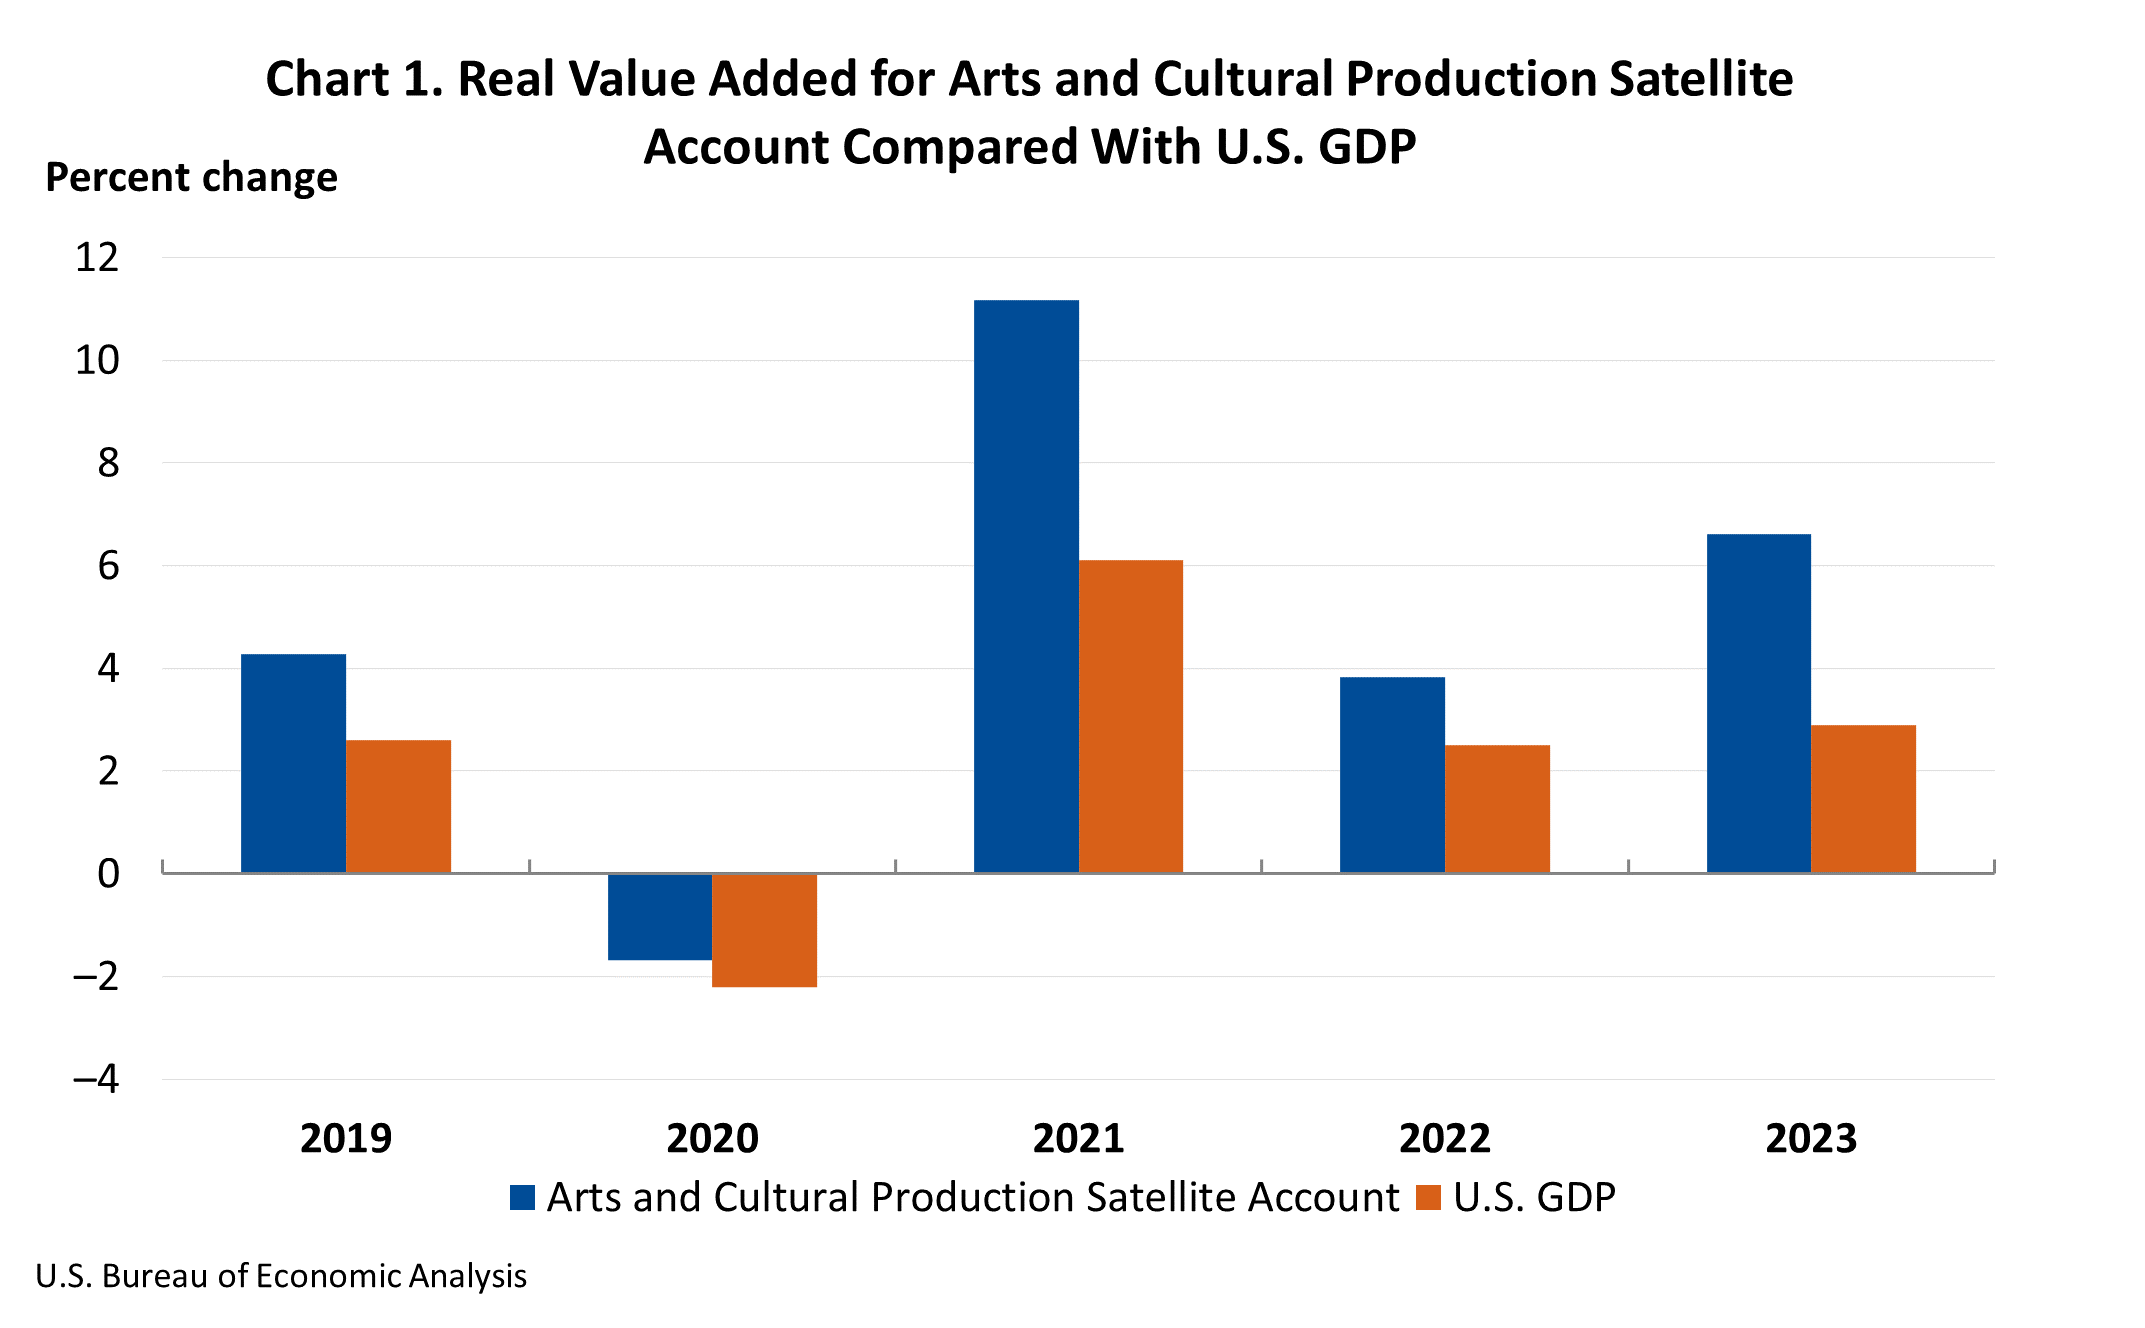
The U.S. Bureau of Economic Analysis (BEA) has released its latest Arts and Cultural Production Satellite Account, revealing a significant surge in the economic activity of the arts and cultural sector in 2023. Adjusted for inflation, this vibrant sector experienced a growth of 6.6 percent, building upon a solid 3.8 percent increase in 2022. This performance outpaced the broader U.S. economy, which saw its real Gross Domestic Product (GDP) expand by 2.9 percent in 2023, up from 2.5 percent in the previous year. In 2023, the arts and cultural sector’s economic footprint was substantial, accounting for 4.2 percent of the nation’s GDP, translating to an impressive $1.17 trillion.
A Deeper Dive into Sectoral Growth
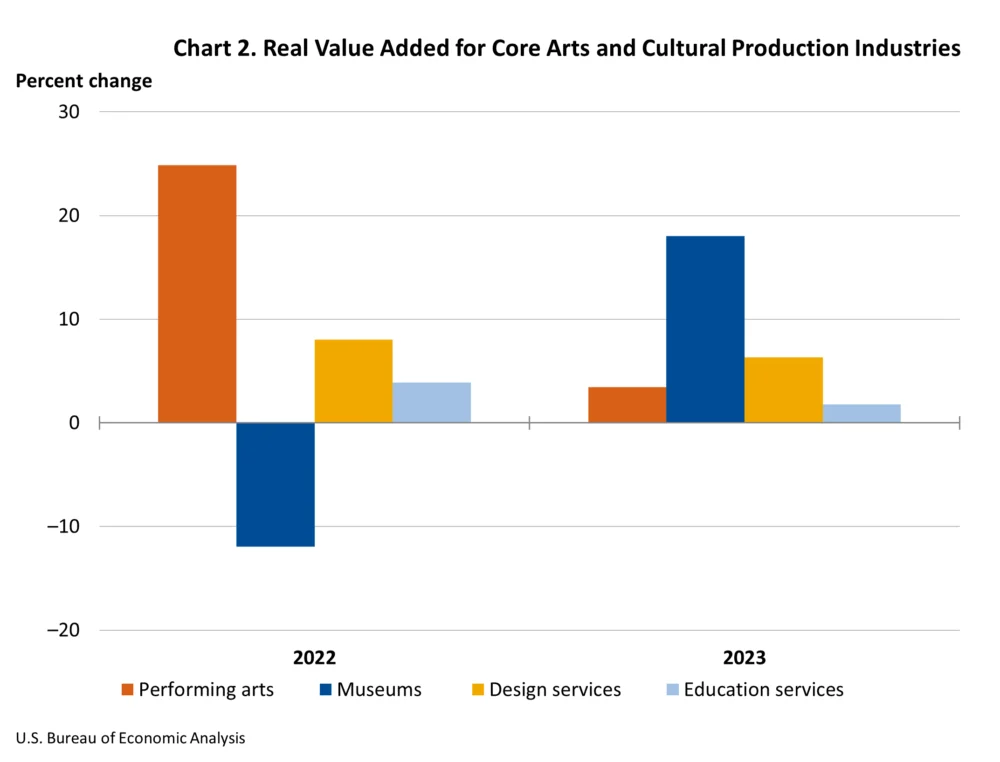
The BEA’s comprehensive report, released today, meticulously details the economic contributions of various sub-sectors within the arts and cultural landscape. The "core" arts and cultural production industries, encompassing performing arts, museums, design services, and fine arts and education services, demonstrated a robust real value added increase of 5.5 percent in 2023. Complementing this growth were the "supporting" arts and cultural production industries, which include art support services and information services. These sectors collectively saw a more pronounced surge of 7.1 percent in real value added during the same period, underscoring the interconnectedness and expansion within the broader creative ecosystem.
Nominal Value Added: A Closer Look at Unadjusted Growth
When examined without the impact of inflation (nominal value added), the national arts and cultural sector exhibited an even more striking growth rate of 7.6 percent in 2023. The primary engine behind this nominal expansion was the supporting arts and cultural production industries, which grew by 6.8 percent to reach $873.8 billion. Within this category, information services played a pivotal role in driving the increase.
The core arts and cultural production industries also experienced substantial nominal growth, with an increase of 10.6 percent, culminating in a total value of $265.8 billion. This impressive rise was predominantly fueled by the performing arts and design services segments. This divergence between real and nominal growth highlights the impact of inflation on the sector, a common economic factor across industries.
State-Level Dynamics: A Patchwork of Prosperity
The economic vitality of the arts and cultural sector was not uniformly distributed across the United States. In 2023, nominal value added within arts and cultural production industries saw an increase in 47 states and the District of Columbia. However, the magnitude of this growth varied considerably. Nevada emerged as the state with the most significant expansion, registering a remarkable 14.7 percent increase in value added. Conversely, Louisiana experienced the largest decline, with a decrease of 3.4 percent.

In Nevada, the surge in arts and cultural economic activity was largely attributed to the robust performance of promoters of performing arts and similar events, the publishing industry, and performing arts companies. This suggests a dynamic and growing live entertainment and creative content production scene in the state. In contrast, the decline in Louisiana was primarily driven by a contraction in the motion picture industry, indicating potential challenges or shifts within that specific sub-sector in the state.
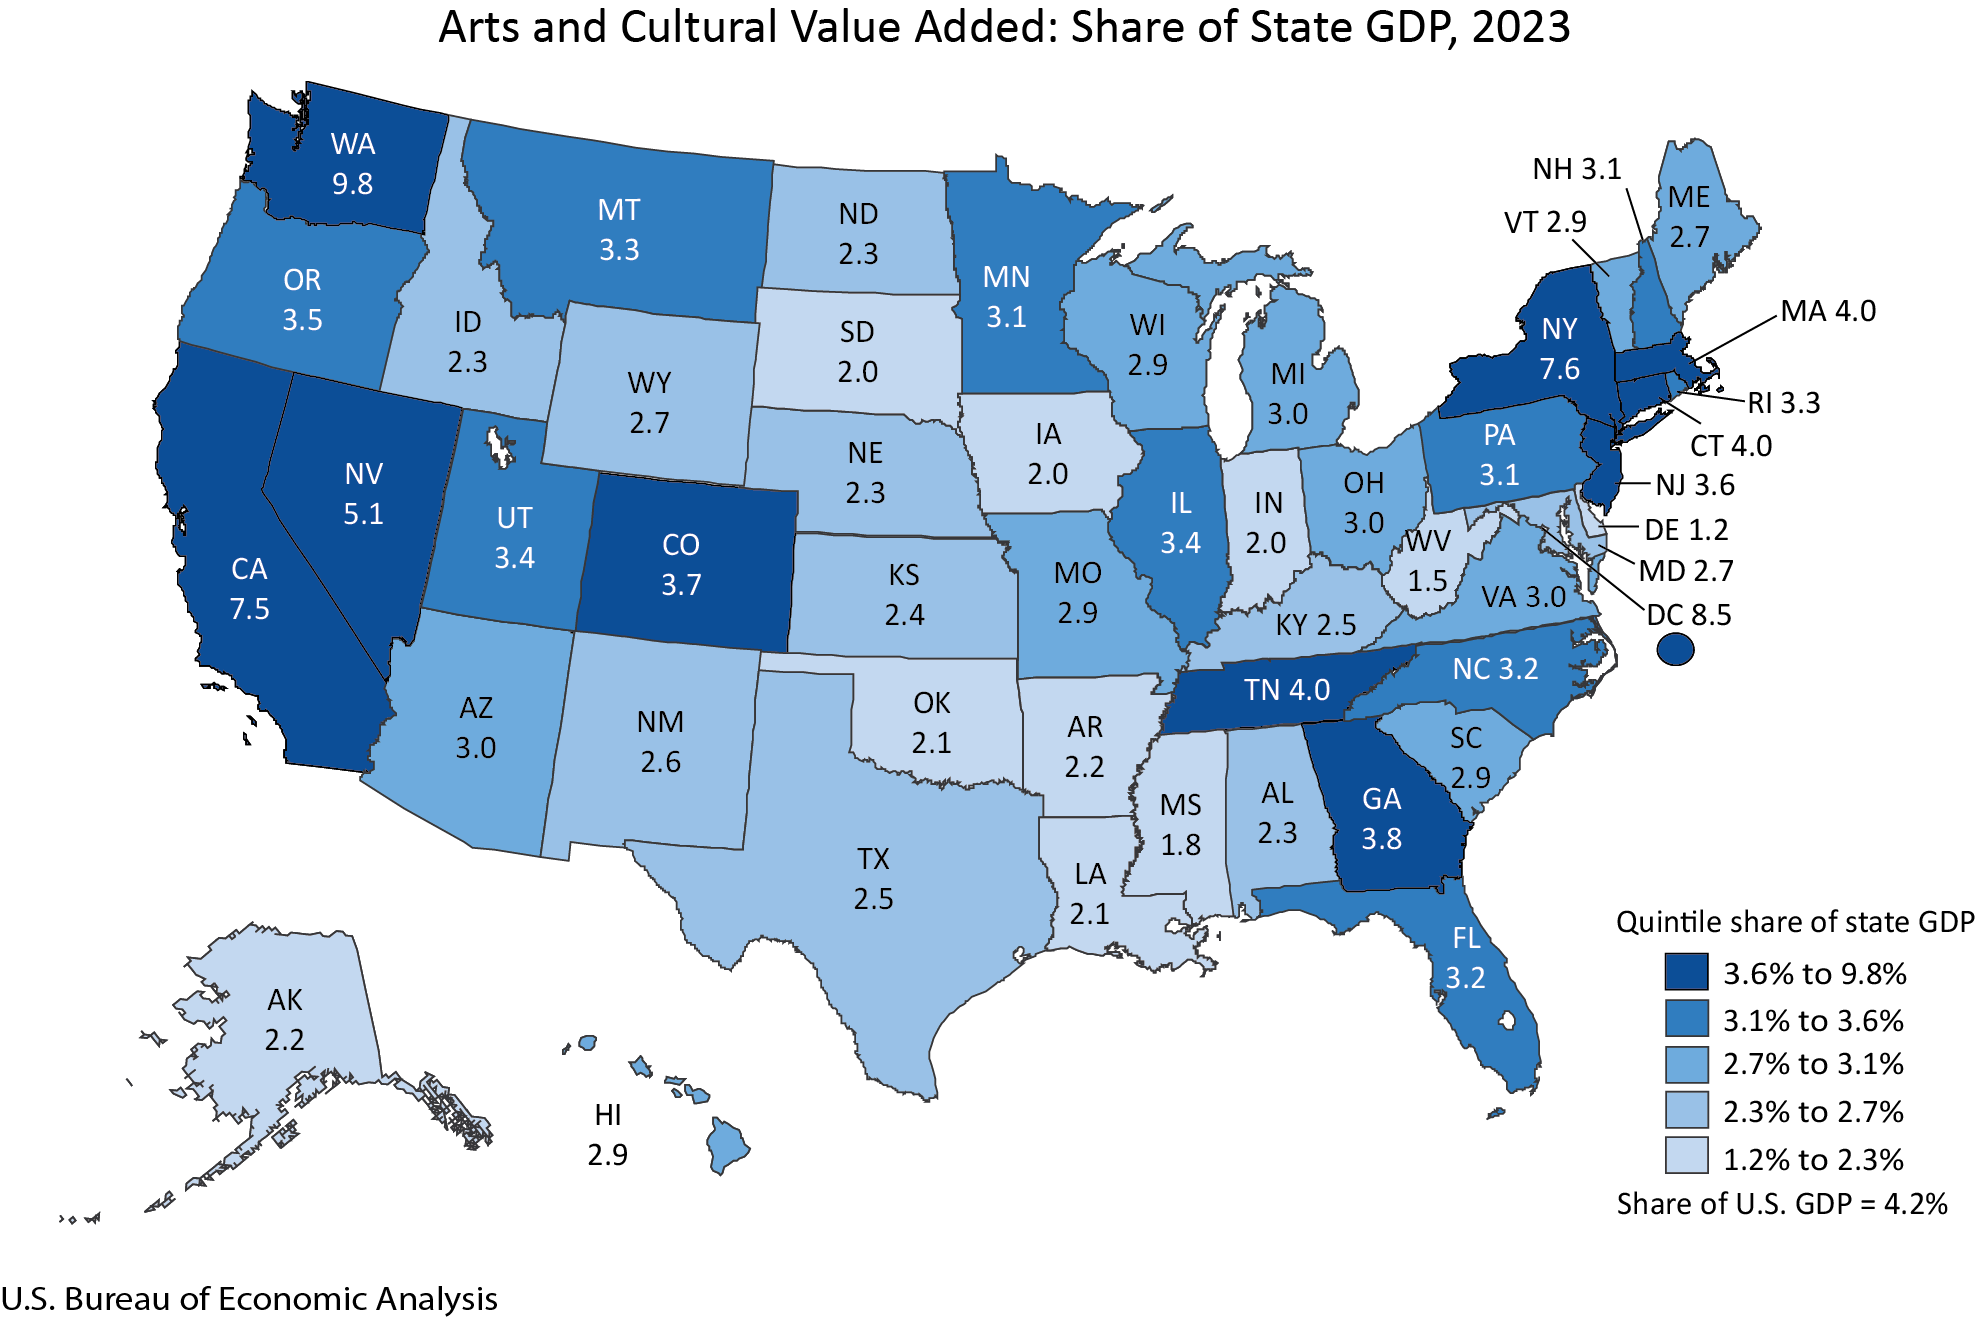
The contribution of arts and cultural activities to a state’s overall economic output also showed considerable variation. Washington state led the nation with arts and cultural value added constituting 9.8 percent of its total GDP. At the other end of the spectrum, Delaware’s arts and cultural sector represented 1.2 percent of its GDP. For the majority of states, the arts and cultural share of GDP fell within the 2 to 5 percent range. Notably, Washington state, the District of Columbia, New York, California, and Nevada were the only jurisdictions where the arts and cultural sector’s share of GDP exceeded 5 percent, signifying their significant economic reliance on and contribution from these creative industries.

The leading arts and cultural production industries also differed significantly from state to state. In Washington state, publishing and retail industries were key contributors to the state’s GDP share from the arts and culture sector. The District of Columbia saw government and advertising as the primary drivers. New York’s economic landscape was influenced by broadcasting and "other information services." California’s growth was spurred by "other information services" and motion pictures. Nevada’s strong performance was a result of contributions from "other information services" and promoters of performing arts and similar events. These variations underscore the diverse nature of arts and cultural economies across the U.S.
Employment Trends: A Modest but Steady Increase
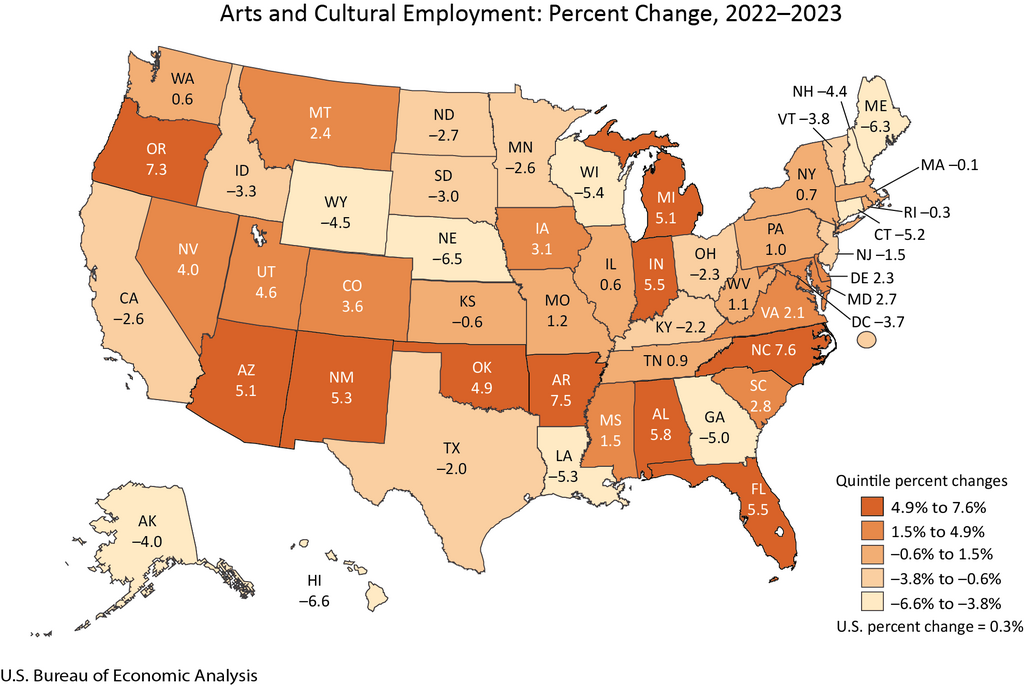
Nationwide, arts and cultural employment experienced a modest but positive increase of 0.3 percent in 2023, bringing the total number of jobs in the sector to 5.4 million. This growth was observed in 27 states. North Carolina led the nation in employment growth, with a 7.6 percent increase in arts and cultural jobs. This translated to 167,254 jobs related to arts and culture in North Carolina, representing 3.3 percent of all jobs within the state. Government and retail industries were identified as the primary contributors to this employment surge in North Carolina.

Conversely, Hawaii experienced the largest decrease in arts and cultural employment, with a decline of 6.6 percent. The report indicated that construction and motion pictures were the leading sectors contributing to this downturn in Hawaii. These figures highlight the varied impact of economic conditions and specific industry trends on employment within the arts and cultural sector across different regions.
Compensation Growth: A Positive Sign for Workers
Arts and cultural compensation across the nation saw a healthy increase of 3.6 percent in 2023. This positive trend extended to 43 states and the District of Columbia, indicating a broad-based improvement in earnings for individuals working within the sector. Nevada again stood out, reporting the highest percentage increase in arts and cultural compensation at 12.7 percent. On the other hand, Georgia experienced the most significant decline, with compensation decreasing by 6.9 percent. This disparity in compensation growth suggests localized economic factors and industry-specific wage pressures are at play.
Methodology and Data Updates: Enhancing Accuracy
The release of these detailed statistics is part of the BEA’s ongoing commitment to providing accurate and timely economic data. The Arts and Cultural Production Satellite Account is a crucial tool for understanding the economic significance of this sector. The updated figures, spanning from 1998 to 2022 at the national level and 2001 to 2022 at the state level, incorporate new and revised source data. These updates, particularly for the period between 2017 and 2023, reflect the 2024 annual update of BEA’s National and Regional Economic Accounts. Furthermore, earlier data from 1998 to 2016 have been revised to align with the 2023 comprehensive update of BEA’s National and Regional Economic accounts. This meticulous process ensures that the arts and cultural production statistics more accurately capture the dynamic nature of the sector.
The development and maintenance of the Arts and Cultural Production Satellite Account are made possible through funding from the National Endowment for the Arts, a testament to the federal government’s recognition of the sector’s importance.
Looking Ahead: Continued Scrutiny of a Vital Sector
The BEA has announced that the next release of the Arts and Cultural Production Satellite Account, which will include data for 2024, is scheduled for March 2026. This regular update cycle allows policymakers, industry stakeholders, and researchers to track the ongoing evolution of the arts and cultural sector and its contributions to the U.S. economy. As this sector continues to grow and adapt, these comprehensive statistics will remain invaluable for informing policy, investment, and strategic planning. The consistent growth observed in 2023, outpacing the broader economy, signals a resilient and increasingly significant contributor to national prosperity. The interplay between core and supporting industries, coupled with state-level variations, offers a nuanced picture of the economic landscape, underscoring the need for targeted support and understanding of the diverse components that constitute America’s vibrant arts and cultural engine. The data suggests a sector that is not only a source of cultural enrichment but also a substantial and growing economic force.


