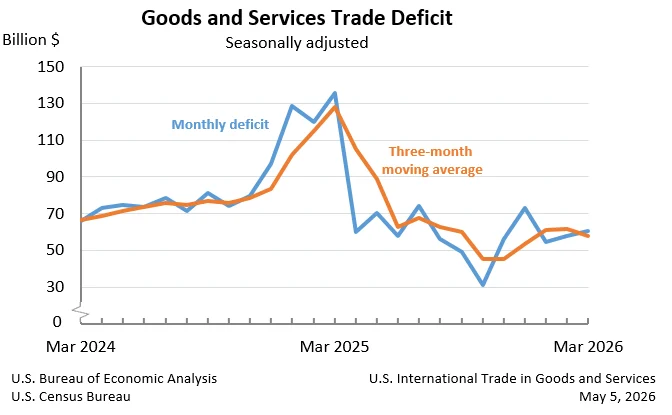
The United States recorded a goods and services deficit of $60.3 billion in March, an increase of $2.5 billion from the revised February figure of $57.8 billion. This widening of the trade gap was driven by a greater expansion in imports compared to exports, according to data released today by the U.S. Census Bureau and the U.S. Bureau of Economic Analysis. The March deficit represents a 4.4% increase from the previous month.
Trade Dynamics in March: Imports Outpace Exports
In March, U.S. exports of goods and services totaled $320.9 billion, an increase of $6.2 billion from February. This upward movement in exports was primarily fueled by a $6.5 billion rise in goods exports, reaching $213.5 billion. However, this was partially offset by a $0.3 billion decrease in services exports, which amounted to $107.4 billion.
On the import side, the total for goods and services reached $381.2 billion, an increase of $8.7 billion from February. Goods imports saw a substantial rise of $10.6 billion, bringing the total to $302.2 billion. Services imports, conversely, experienced a decline of $1.9 billion, settling at $79.0 billion. The net effect of these movements was a widening of the overall trade deficit.
Deeper Dive into Goods and Services Balances
The increase in the overall goods and services deficit in March was a result of conflicting trends in its components. The deficit in goods widened by $4.1 billion to $88.7 billion. This indicates that the value of imported goods exceeded the value of exported goods by a greater margin in March than in February. Simultaneously, the surplus in services, which represents the excess of services exports over services imports, increased by $1.6 billion to $28.4 billion. Despite the growing services surplus, the larger expansion in the goods deficit dominated the overall trade balance.
Real Goods Trade and Price Adjustments
When adjusted for inflation, the picture for goods trade shows a more pronounced increase in the deficit. The real goods deficit, measured in 2017 dollars on a Census basis, expanded by $5.7 billion, or 6.7%, to $90.8 billion in March. This figure represents a larger percentage increase than the 4.7% rise seen in the nominal goods deficit, suggesting that the growth in imported goods’ value outpaced the growth in their volume more significantly than for exported goods. This distinction between nominal and real trade figures is crucial for understanding the underlying physical flow of goods and the impact of price changes on the trade balance.
Revisions to February Data
The Bureau of Economic Analysis also provided revised figures for February trade. While the exact details of these revisions were not fully elaborated in the provided text, they contribute to the overall understanding of trade dynamics leading into March. Such revisions are common as more comprehensive data becomes available and are essential for ensuring the accuracy of economic indicators.
Year-to-Date Trends Contrast March’s Performance
Looking at the year-to-date figures, a different narrative emerges. For the period from January through March, the cumulative goods and services deficit has decreased by a significant $211.2 billion, or 55.0%, compared to the same period in 2025. This substantial reduction is attributed to a strong performance in both exports and imports during the earlier part of the year. Exports have increased by $100.2 billion, representing a 12.0% rise, while imports have decreased by $111.0 billion, a 9.1% decline. This divergence suggests that while March saw a widening deficit due to import growth outpacing export growth, the broader trend for the year thus far has been a contraction in the trade deficit, driven by robust export performance and a reduction in import levels.
Three-Month Moving Averages Offer Smoother Perspective
To account for the volatility inherent in monthly trade data, economists often look at three-month moving averages. For the three months ending in March, the average goods and services deficit decreased by $4.2 billion to $57.6 billion. This indicates a moderation in the deficit compared to the single-month figure. On a year-over-year basis, this three-month average deficit has declined substantially, down $70.4 billion from the three months ending in March 2025. This sustained decrease in the average deficit over a longer period reinforces the observation of an improving trade balance trend for the year.
Bilateral Trade Balances: Key Trading Partners
The detailed breakdown of trade balances with specific countries and regions in March reveals a complex web of international economic relationships. The U.S. recorded trade surpluses with several key partners. Notable among these were the Netherlands ($7.4 billion), the United Kingdom ($6.1 billion), Hong Kong ($5.8 billion), and South and Central America ($5.0 billion). Surpluses were also observed with Switzerland ($4.3 billion), Australia ($2.2 billion), Singapore ($1.9 billion), Brazil ($1.4 billion), and Belgium ($0.6 billion). These surpluses suggest that U.S. exports to these regions exceeded U.S. imports from them.
Conversely, the U.S. maintained significant trade deficits with several other major economies. The largest deficits were recorded with Taiwan ($20.6 billion), Vietnam ($19.2 billion), Mexico ($16.4 billion), and China ($14.0 billion). Deficits were also present with the European Union ($9.2 billion), Germany ($5.0 billion), South Korea ($4.8 billion), Japan ($4.1 billion), Malaysia ($4.0 billion), India ($3.8 billion), Canada ($3.6 billion), Ireland ($2.9 billion), Italy ($2.3 billion), Saudi Arabia ($0.7 billion), and Israel ($0.4 billion). These deficits highlight areas where U.S. imports from these countries significantly outweighed U.S. exports.
Contextualizing the Trade Deficit
The U.S. trade deficit is a complex economic indicator that reflects the balance between the value of goods and services a country imports and exports. A deficit means a country is buying more from the rest of the world than it is selling to it. This can have various implications for the domestic economy, including impacts on employment, currency values, and national debt.
Historically, the U.S. has experienced persistent trade deficits, particularly in goods, driven by factors such as strong consumer demand, global supply chain dynamics, and differing production costs. The goods deficit has often been a larger concern than the services surplus, as services trade tends to be more balanced for the U.S.
The data released today, showing a widening deficit in March but a significant contraction year-to-date, presents a nuanced picture. While the month-to-month increase in the deficit warrants attention, the broader trend of deficit reduction for the year suggests underlying strengths in U.S. export capacity or a recalibration of import demand.
Potential Implications and Analysis
The widening of the trade deficit in March, driven by imports growing at a faster pace than exports, could have several implications. A larger deficit can indicate increased domestic demand for foreign goods, which can be a sign of economic strength. However, it can also signal a loss of competitiveness for domestic producers if imports are displacing U.S.-made goods.
The robust growth in exports seen earlier in the year and the decrease in imports year-to-date are positive indicators. They suggest that U.S. businesses are successfully expanding their reach into international markets, and that import substitution or a general reduction in import volumes might be occurring. The decrease in the three-month moving average deficit further supports the idea that the March uptick might be a temporary fluctuation rather than a reversal of the improving trend.
The significant differences in trade balances with various countries underscore the complexity of global trade. For instance, the large deficit with China, while smaller than in some previous periods, remains a focal point for trade policy discussions. Conversely, surpluses with countries like the Netherlands and the UK highlight strong trading relationships in other areas.
The distinction between nominal and real trade figures is also important. The fact that the real goods deficit increased at a faster rate than the nominal deficit in March suggests that price increases for imported goods played a significant role in widening the nominal deficit. This could be influenced by global commodity price fluctuations or currency exchange rates.
Upcoming Data and Revisions
The U.S. Census Bureau and the Bureau of Economic Analysis also provided advance notice of upcoming significant revisions to international trade data. Beginning with the release on June 9, 2026, statistics on trade in goods, both on a Census basis and a balance of payments (BOP) basis, will be revised back to 2021. Additionally, statistics on trade in services will be revised beginning with 1999. These comprehensive revisions are part of the regular process of updating economic accounts to incorporate more complete source data and improve statistical methodologies.
These forthcoming revisions will also be reflected in other BEA reports, including the "U.S. International Transactions and Investment Position, 1st Quarter 2026 and Annual Update," scheduled for release on June 24, 2026. Such extensive revisions are critical for maintaining the accuracy and relevance of economic data used by policymakers, businesses, and researchers.
The next release of the U.S. International Trade in Goods and Services report, covering April 2026 data, is scheduled for June 9, 2026. This upcoming report will provide further insights into the ongoing dynamics of U.S. international trade.