Lana Rhoades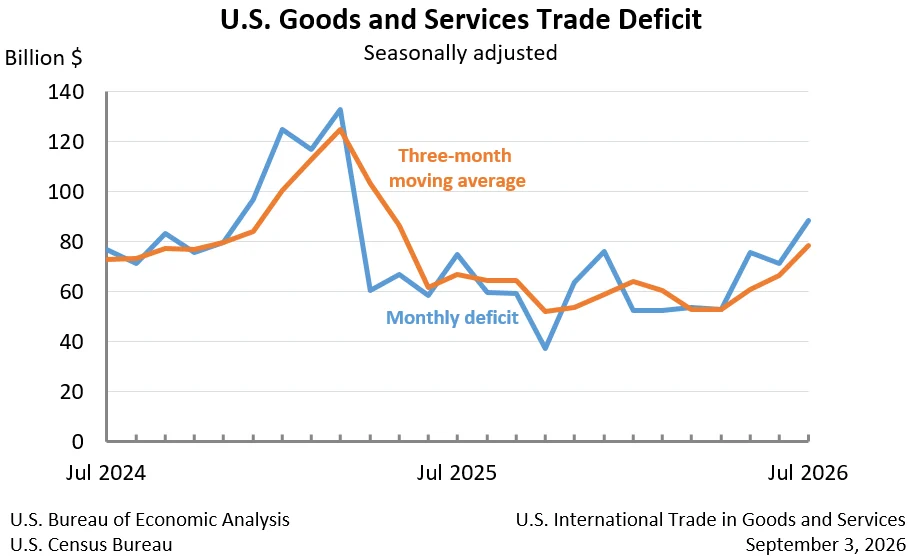
The United States experienced a substantial widening of its trade deficit in goods and services in July, reaching $88.6 billion. This represents a significant increase of $17.4 billion from the revised June figure of $71.2 billion, according to joint data released today by the U.S. Census Bureau and the U.S. Bureau of Economic Analysis. This escalation in the deficit underscores a dynamic shift in international trade flows, with imports showing robust growth while exports faced a contraction.
Key Figures Reveal Trade Imbalance
The July data paints a clear picture of the widening trade gap. The overall goods and services deficit surged by 24.4% to $88.6 billion. This was a direct consequence of contrasting movements in exports and imports. Exports of goods and services saw a decline of 2.1%, falling to $310.7 billion in July. Conversely, imports surged by 2.8%, reaching $399.3 billion. This divergence, where imports outpaced exports, is a primary driver behind the increased trade deficit.
Digging deeper into the components of the trade balance reveals that the goods deficit was the primary contributor to the overall increase. The deficit in goods alone expanded by $17.6 billion to $119.6 billion. While the services sector maintained a surplus, it saw a marginal increase of $0.2 billion, bringing its surplus to $31.0 billion. This indicates that while the U.S. continues to hold an advantage in services trade, the growing deficit in physical goods is overshadowing this strength.
A Closer Look at Monthly Trends
In July, U.S. exports totaled $310.7 billion, a decrease of $6.6 billion compared to June. This decline was attributed to a $6.2 billion drop in goods exports, which fell to $201.0 billion. Exports of services also saw a slight decrease of $0.4 billion, amounting to $109.7 billion.
On the import side, the picture was one of expansion. Total imports rose by $10.8 billion to $399.3 billion. The bulk of this increase was driven by goods imports, which climbed by $11.4 billion to $320.6 billion. In contrast, imports of services saw a slight decrease of $0.6 billion, settling at $78.7 billion.
The nominal goods deficit on a Census basis (unadjusted for seasonal variations or price changes) saw an increase of $12.0 billion, reaching $106.4 billion in July. This represents a 12.7% increase in the real goods deficit, adjusted for inflation, compared to a 17.7% increase in the nominal deficit, highlighting the impact of price changes on the overall trade picture.
Revisions and Data Accuracy
The Census Bureau and the Bureau of Economic Analysis also announced revisions to the trade data for January through June 2026. These revisions were incorporated to reflect more comprehensive and updated quarterly and monthly data, ensuring the accuracy of the reported figures. Such revisions are standard practice and aim to provide the most precise picture of trade flows.
Three-Month Moving Averages Offer Smoother Perspective
To smooth out month-to-month volatility, the report also examined three-month moving averages. For the three months ending in July, the average goods and services deficit increased by $11.9 billion to $78.5 billion. This sustained increase over a slightly longer period suggests that the widening deficit is not merely a fleeting anomaly but a more entrenched trend. Year-over-year, the average goods and services deficit also saw an increase of $11.7 billion compared to the three months ending in July 2025, indicating a persistent widening of the trade imbalance.
Trade Balances by Country and Region
The report also provides insights into trade balances with specific countries and regions. In July, the U.S. recorded trade surpluses in goods with the Netherlands ($7.8 billion), South and Central America ($6.6 billion), Hong Kong ($3.1 billion), the United Kingdom ($2.5 billion), Brazil ($2.4 billion), Singapore ($1.9 billion), Saudi Arabia ($1.3 billion), Australia ($1.2 billion), and Belgium ($0.9 billion).
Conversely, significant deficits were observed with Mexico ($27.5 billion), Vietnam ($23.3 billion), Taiwan ($18.1 billion), China ($15.2 billion), South Korea ($10.4 billion), the European Union ($8.9 billion), Germany ($5.6 billion), India ($5.0 billion), Malaysia ($4.8 billion), Japan ($4.2 billion), Ireland ($3.9 billion), Canada ($3.2 billion), Italy ($2.5 billion), France ($1.3 billion), Switzerland ($0.6 billion), and Israel ($0.5 billion).
Quarterly data, which is available with a one-month lag, offered a broader perspective on trade with selected countries and areas on a balance of payments basis. For the second quarter, surpluses were recorded with the Netherlands ($29.6 billion), South and Central America ($21.7 billion), Singapore ($15.9 billion), Hong Kong ($15.1 billion), Brazil ($12.7 billion), Ireland ($12.1 billion), Switzerland ($10.6 billion), Australia ($9.3 billion), the United Kingdom ($9.1 billion), Saudi Arabia ($4.7 billion), Belgium ($3.2 billion), and the European Union ($2.0 billion).
Deficits in the second quarter were notable with Vietnam ($61.2 billion), Taiwan ($53.1 billion), Mexico ($52.7 billion), China ($32.3 billion), Germany ($19.2 billion), South Korea ($14.6 billion), Canada ($13.7 billion), India ($12.2 billion), Malaysia ($11.4 billion), Italy ($9.7 billion), France ($6.3 billion), Japan ($4.9 billion), and Israel ($1.5 billion).
Context and Potential Implications
The widening trade deficit in July comes at a time of global economic flux. Factors such as varying rates of economic recovery across different nations, shifts in consumer demand, and ongoing geopolitical influences can all contribute to changes in trade balances. A persistent and growing trade deficit can have several macroeconomic implications.
Firstly, it can contribute to a nation’s current account deficit, which represents the difference between a country’s savings and investment. A larger current account deficit may signal an increased reliance on foreign capital to finance domestic spending, which could have long-term implications for national debt and currency valuation.
Secondly, while a strong dollar can make imports cheaper and exports more expensive, thereby contributing to a widening deficit, it can also reflect strong domestic demand. The robust growth in imports suggests that U.S. consumers and businesses are actively purchasing foreign-made goods and services.
However, a sustained trade deficit can also raise concerns about domestic manufacturing competitiveness and job creation. If imports are consistently outpacing exports, it could indicate that domestic industries are struggling to compete on the global stage, potentially leading to job losses in certain sectors.
The U.S. economy has shown resilience in various sectors, and the robust import figures might also reflect strong domestic consumption and investment. The interplay between domestic economic health and international trade dynamics is complex and multifaceted.
Looking Ahead
The next release of U.S. International Trade in Goods and Services data is scheduled for Tuesday, October 6, 2026, covering August 2026 figures. This subsequent report will provide further insights into whether the widening trade deficit observed in July represents a continuing trend or a temporary fluctuation.
It is also noteworthy that with the August 2026 release, the U.S. Census Bureau will update its country name references. "Nauru" will be replaced with "Naoero" to align with the country’s official name change and its recognition by the U.S. Department of State and the International Organization for Standardization.
The detailed data from the Census Bureau and the Bureau of Economic Analysis serves as a critical indicator for policymakers, businesses, and investors, offering a snapshot of the nation’s economic engagement with the rest of the world. Understanding these trade flows is essential for navigating the complexities of the global marketplace and formulating effective economic strategies.