Lana Rhoades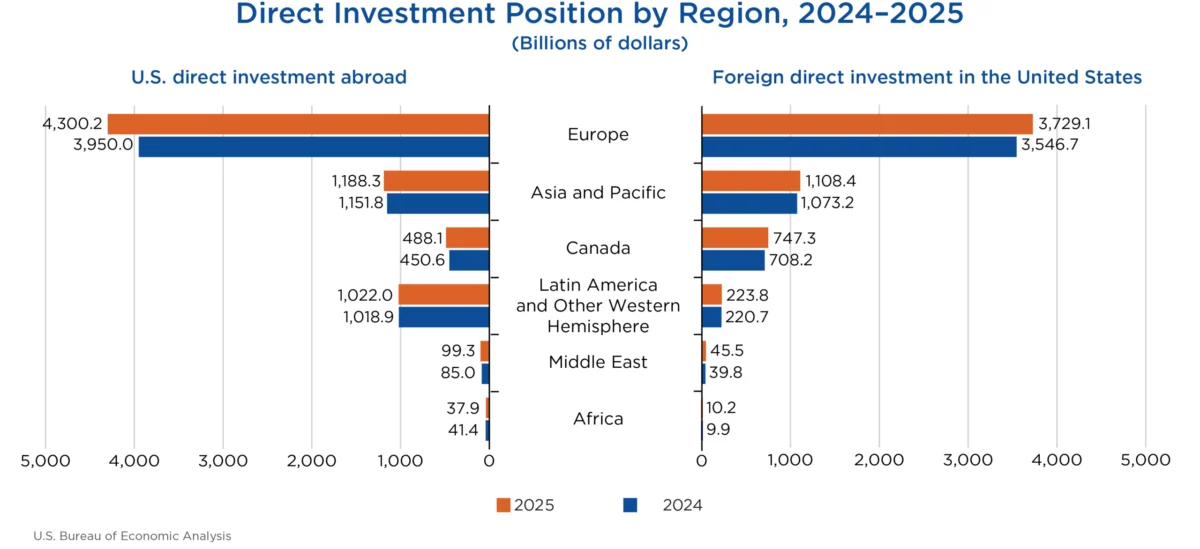
The cumulative level of U.S. direct investment abroad, a key indicator of American economic engagement with the global marketplace, experienced a substantial expansion in 2025, reaching a new high of $7.14 trillion. This marks an increase of $438.1 billion from the previous year, according to the latest statistics released by the U.S. Bureau of Economic Analysis (BEA). This robust growth underscores the continued dynamism of U.S. multinational enterprises (MNEs) in extending their reach and operations across international borders. The surge in outward investment was predominantly fueled by a significant $350.2 billion increase in the U.S. direct investment position in Europe, with particular strength observed in the United Kingdom and Luxembourg. By sector, manufacturing activities, especially within the chemical manufacturing sub-sector, were the primary drivers of this upward trend.
Simultaneously, foreign direct investment (FDI) flowing into the United States also demonstrated considerable momentum, with the cumulative position climbing by $266.0 billion to $5.86 trillion by the close of 2025. This inflow of foreign capital signifies persistent international confidence in the U.S. economy as a destination for investment. Similar to the outward investment trend, Europe played a pivotal role in this increase, contributing $182.4 billion to the overall growth in FDI within the United States. Among specific foreign national entities, German multinationals led the charge with an impressive $49.0 billion increase in their U.S. investment position, followed closely by Canadian multinationals, which expanded their stake by $39.2 billion. The manufacturing sector in the U.S. was a significant beneficiary of this foreign capital, with the electrical equipment and components manufacturing sub-sector experiencing the most substantial gains.
A Deeper Dive into Investment Flows
The BEA’s comprehensive data reveals intricate patterns in both outward and inward investment, offering insights into the strategic priorities of global corporations and the economic interconnectedness of nations. The figures for 2025 not only reflect a period of economic expansion but also highlight evolving trends in cross-border capital allocation.
U.S. Direct Investment Abroad: Key Destinations and Sectors
U.S. multinational enterprises maintain a widespread presence, with investments in nearly every corner of the globe. However, a significant concentration of this outward investment is observed in a select few countries. In 2025, more than half of the total U.S. direct investment abroad was concentrated in five key nations: the United Kingdom, holding the top spot with a substantial $1,114.7 billion position; followed by the Netherlands at $1,044.0 billion; Luxembourg with $645.3 billion; Ireland at $511.9 billion; and Canada, with a significant $488.1 billion.
When examining the investment by industry of the directly owned foreign affiliate, holding companies emerged as the dominant sector, accounting for an impressive 45.8 percent of the overall U.S. direct investment position abroad in 2025. This suggests a strategic emphasis on managing and consolidating international operations through these entities. Manufacturing affiliates followed, representing 15.9 percent of the total, underscoring the continued importance of production and supply chain investments overseas. Finance and insurance affiliates constituted the third-largest sector, with 13.5 percent of U.S. investment abroad, indicating the global reach of American financial services.
Analyzing the investment from the perspective of the U.S. parent company, MNEs engaged in manufacturing activities accounted for the largest share of direct investment abroad, representing 50.2 percent of the total position. This reflects the global footprint of American manufacturing giants in establishing production facilities and distribution networks. MNEs in the finance and insurance sectors followed, contributing 15.8 percent of the outward investment, further emphasizing the global nature of the financial industry.
The income generated from these overseas investments also saw a healthy increase. U.S. MNEs earned a total of $660.1 billion in income from their cumulative foreign investments in 2025, an 11.1 percent rise from the previous year. The most significant income growth was observed in holding companies, which saw an increase of $40.0 billion. Conversely, income generated by finance and insurance affiliates experienced a decline of $6.3 billion compared to 2024, a trend that may warrant further monitoring.
Foreign Direct Investment in the United States: Top Investors and Industries
On the inward investment front, the U.S. economy continues to be an attractive destination for foreign capital. In 2025, four countries accounted for over half of the total foreign direct investment in the United States. Japan led as the top investing nation, with a substantial position of $776.3 billion. The Netherlands followed closely with $751.8 billion, followed by Canada at $747.3 billion, and the United Kingdom with $738.3 billion.
A more nuanced view emerges when considering the ultimate beneficial owner (UBO) – the entity at the apex of the global ownership chain. On this basis, Japan remained the leading investing country with a position of $827.1 billion. Canada secured the second spot with $819.8 billion, and Germany ranked third with $706.2 billion. This UBO analysis revealed a significant difference for investments originating from the Netherlands and Luxembourg. Their reported investment positions were considerably lower on a UBO basis compared to the country of foreign parent, indicating that a substantial portion of capital flowing through these financial hubs ultimately originates from investors in other countries. This highlights the role of these jurisdictions as conduits for international investment.
The U.S. manufacturing sector was a primary recipient of foreign direct investment, attracting 42.8 percent of the total position. The sheer scale of this investment is evident, with $2.51 trillion flowing into U.S. manufacturing. Within this sector, chemical manufacturing stood out, accounting for a third of the total manufacturing investment, or $835.9 billion. Significant investments were also directed towards the finance and insurance sectors ($629.7 billion) and wholesale trade ($534.0 billion), underscoring the diverse areas attracting foreign capital.
The income earned by foreign MNEs from their investments in the United States in 2025 amounted to $310.1 billion. This represents a slight decrease of 1.9 percent compared to the income earned in 2024, a trend that may reflect shifts in market conditions or investment returns within the U.S. economy.
Historical Context and Revisions to Data
The release of the 2025 data also included revisions to previously published statistics for 2022, 2023, and 2024. These revisions, a standard practice in economic data collection, are crucial for ensuring the accuracy and reliability of the reported figures. They incorporate newly available and revised source data, allowing for a more precise understanding of economic trends.
For instance, the U.S. direct investment abroad position for 2023 was revised from $6,620 billion to $6,598 billion, and for 2024, it was adjusted from $6,827 billion to $6,698 billion. Similarly, foreign direct investment in the United States for 2023 was revised from $5,376 billion to $5,338 billion, and for 2024, it was adjusted from $5,708 billion to $5,598 billion. Data for 2022 regarding U.S. direct investment abroad was not revised. These adjustments, while seemingly minor in percentage terms, are significant in absolute dollar amounts and reflect the ongoing refinement of economic measurement methodologies.
The BEA’s commitment to data accuracy is further exemplified by its updated disclosure avoidance method, which now includes coarsening techniques such as rounding, aggregation, and the use of ranges. This approach aims to enhance the publication of more granular data while rigorously safeguarding the confidentiality of survey respondents, a critical aspect of maintaining trust in data collection efforts.
Broader Economic Implications and Future Outlook
The trends observed in 2025’s direct investment data offer several key takeaways for the broader economic landscape. The continued strength of both U.S. outward investment and foreign inward investment signals a robust and interconnected global economy. The significant inflows into the U.S. manufacturing sector, particularly in chemicals and electrical equipment, suggest ongoing reshoring or nearshoring efforts, or a strategic positioning of global supply chains within the United States to leverage its market access and skilled workforce.
The dominance of Europe as a source of both outward and inward investment highlights its enduring importance in global capital flows. The specific focus on the United Kingdom and Luxembourg for U.S. outward investment, and their roles as significant conduits for FDI into the U.S., underscores their strategic positions within the international financial architecture.
The income generated from these investments provides a vital contribution to national economies. The increase in income from U.S. direct investment abroad suggests positive returns for American companies operating internationally, contributing to overall economic growth and corporate profitability. Conversely, the slight dip in income from foreign direct investment in the U.S. may warrant further analysis to understand its drivers, whether it’s sector-specific challenges, broader market dynamics, or a normalization after a period of exceptionally high returns.
The BEA’s commitment to providing detailed data tables, accessible through its Interactive Data Application and various downloadable formats, empowers researchers, policymakers, and businesses to conduct in-depth analysis. These resources are invaluable for understanding the intricacies of international investment and its impact on domestic economies.
Looking ahead, the next release of direct investment data in July 2027, covering 2026, will be crucial for observing whether these trends continue or if new patterns emerge. Factors such as geopolitical developments, shifts in global trade policies, and evolving technological landscapes will likely shape the trajectory of direct investment in the coming years. The BEA’s ongoing efforts to refine its data collection and reporting methods will ensure that these crucial economic indicators remain a reliable guide for navigating the complexities of the global economic environment. The continued flow of both outward and inward direct investment is a testament to the interconnectedness of national economies and the strategic importance of global capital mobility in driving innovation and growth.