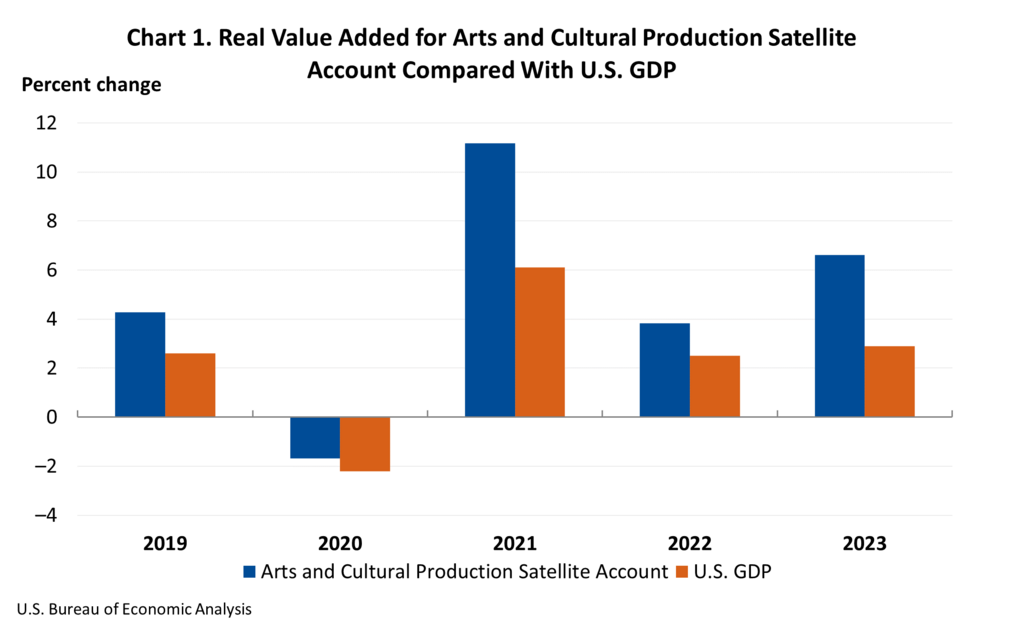
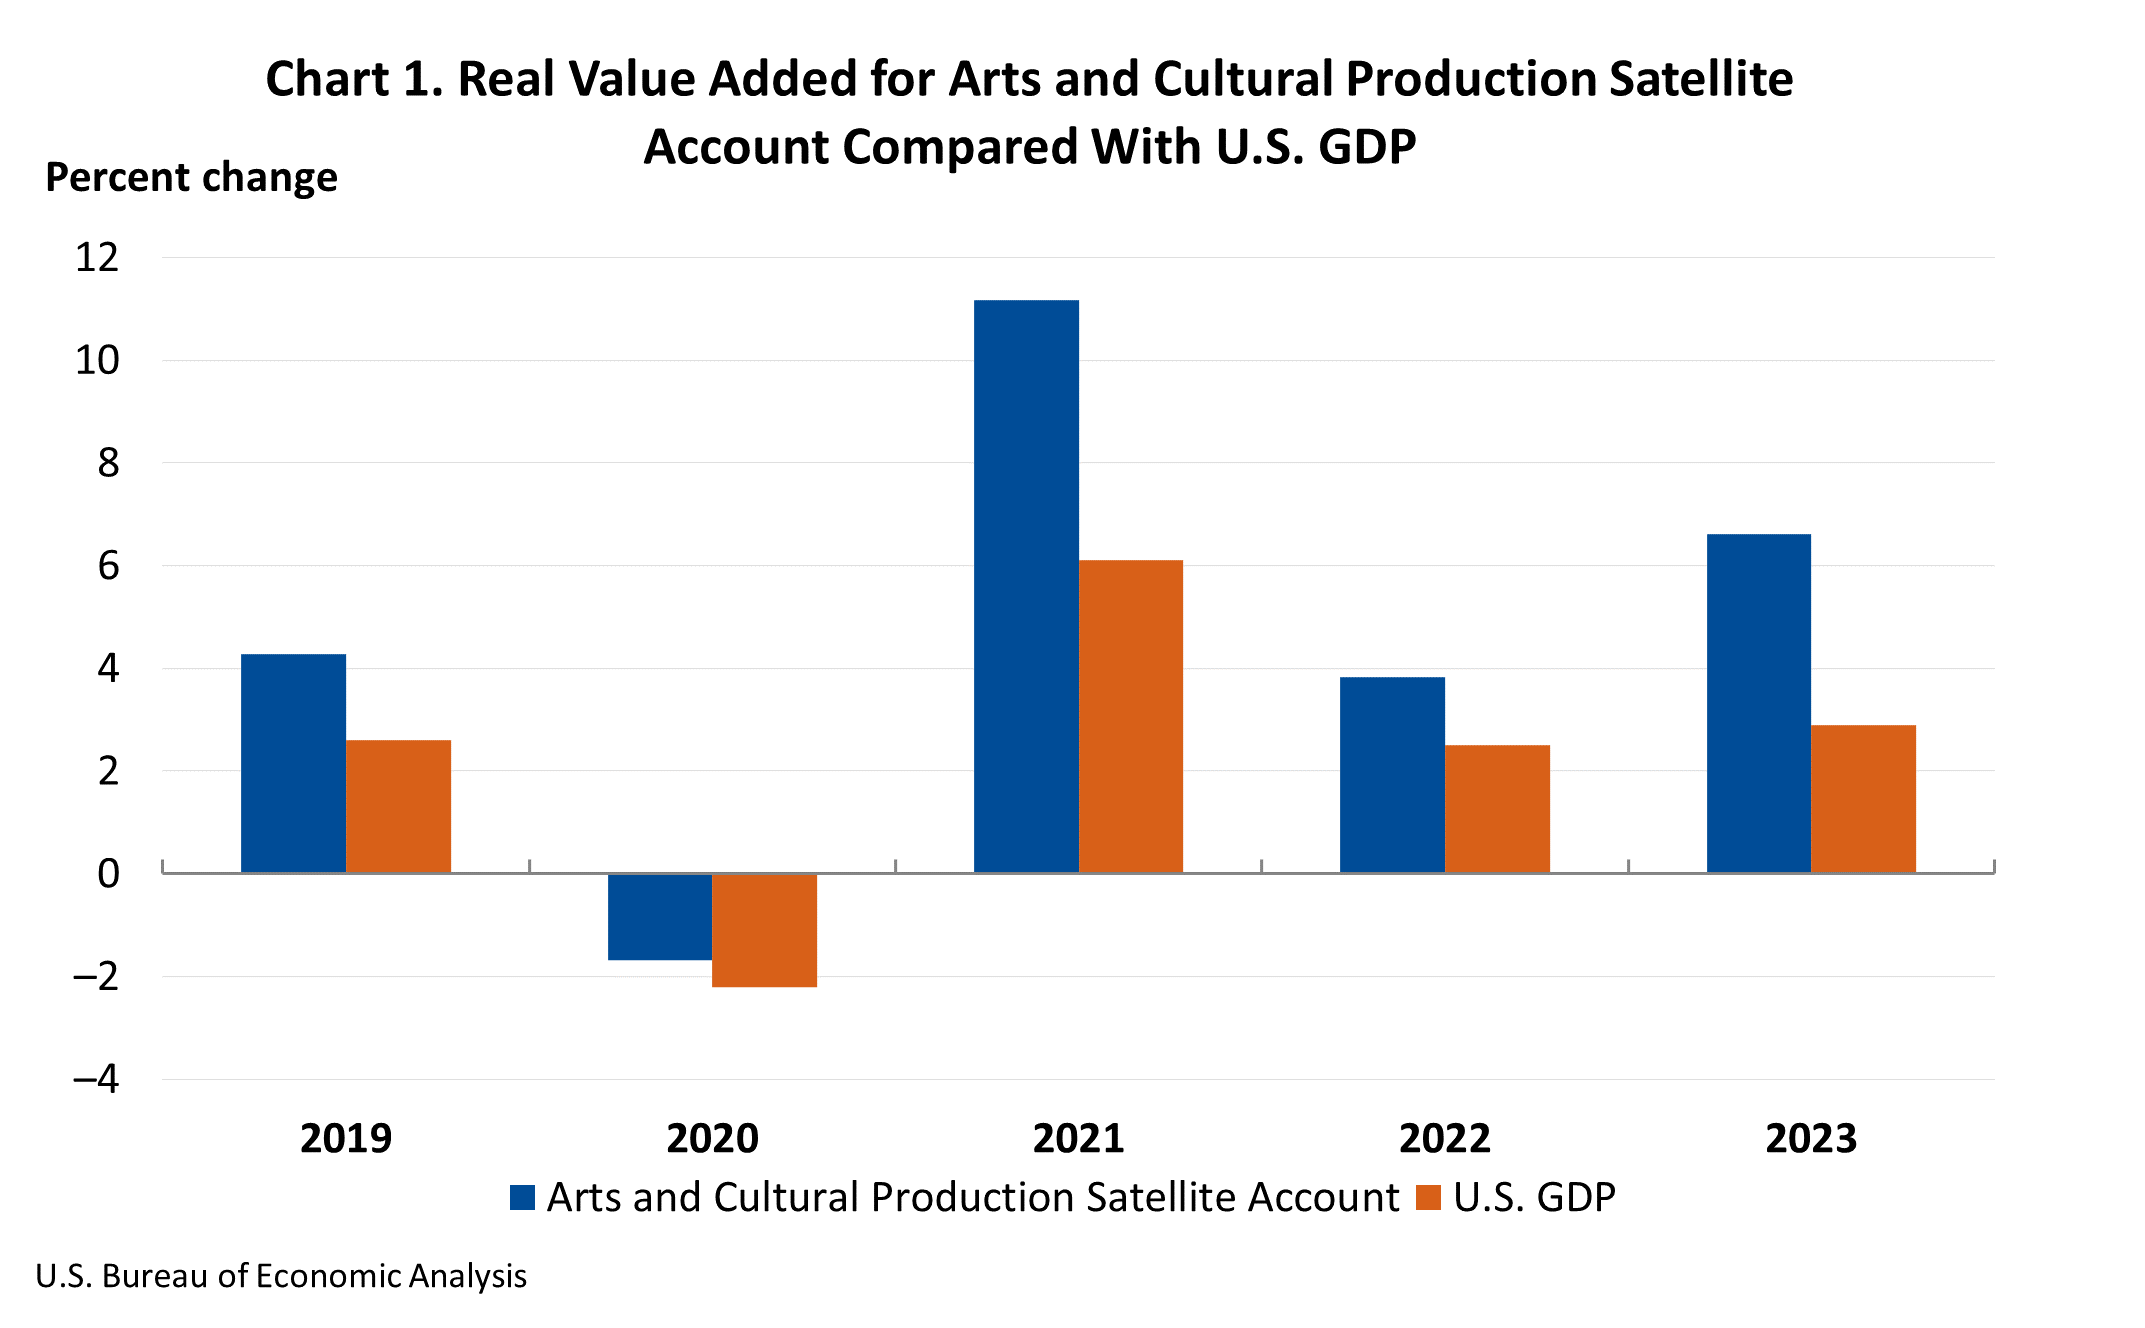
The United States’ vibrant arts and cultural sector demonstrated remarkable resilience and expansion in 2023, significantly outpacing the broader economy. According to the latest Arts and Cultural Production Satellite Account released by the U.S. Bureau of Economic Analysis (BEA), economic activity within this dynamic sector, after accounting for inflation, surged by an impressive 6.6 percent. This robust growth follows a solid increase of 3.8 percent in 2022, underscoring a sustained upward trajectory for arts and culture. In contrast, the overall U.S. economy, as measured by real gross domestic product (GDP), saw a more modest expansion of 2.9 percent in 2023, building upon a 2.5 percent increase in the previous year.
This substantial growth signifies that the arts and cultural sector is not merely keeping pace but is actively contributing to the nation’s economic vitality. In 2023, arts and cultural economic activity accounted for a significant 4.2 percent of the total U.S. GDP, translating to a staggering $1.17 trillion in economic value. This figure highlights the sector’s substantial contribution to national wealth and its role as a key economic engine.
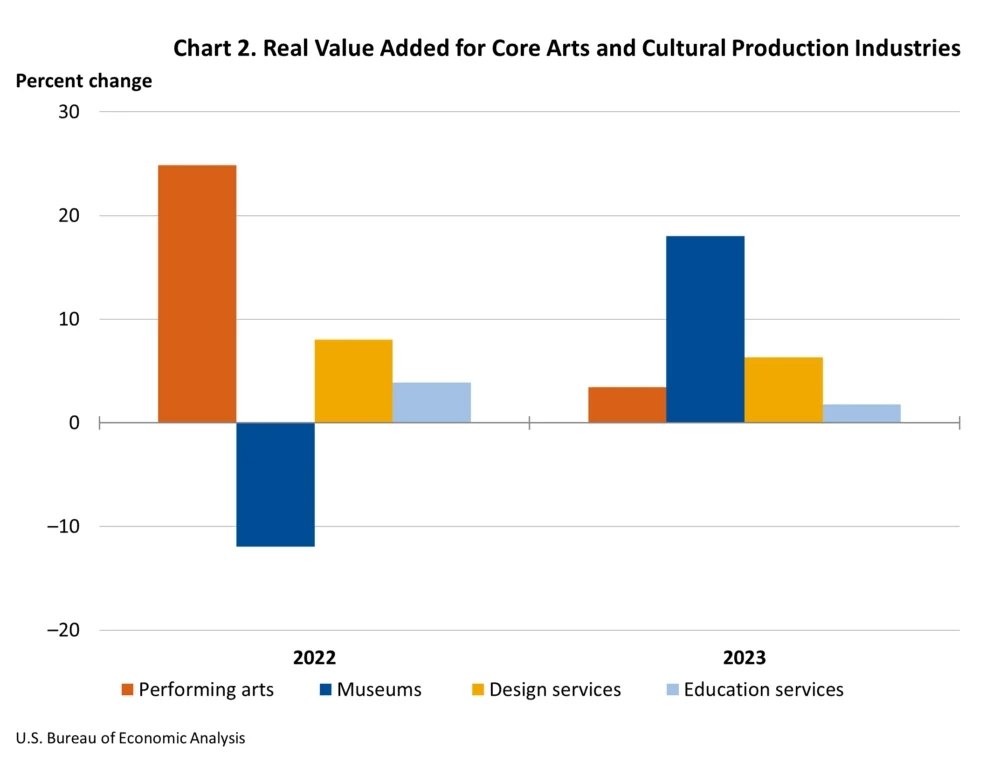
Diving Deeper: Core vs. Supporting Industries
The BEA’s detailed analysis further breaks down this growth into core and supporting arts and cultural production industries. Core industries, encompassing performing arts, museums, design services, fine arts education, and other educational services, experienced a substantial inflation-adjusted increase of 5.5 percent in 2023. This indicates a strong performance in the foundational elements of the arts and cultural landscape.
Simultaneously, supporting arts and cultural production industries, which include critical areas like art support services and information services, exhibited even more vigorous growth, expanding by 7.1 percent in 2023. This surge in supporting industries suggests an increasing demand for the services that enable and amplify creative output, pointing to a healthy and interconnected ecosystem.
Nominal Value Added: A Broader Financial Picture
Beyond inflation-adjusted figures, the BEA also reported on nominal value added, which reflects the raw financial contribution without accounting for price changes. Nationally, nominal value added within the arts and cultural sector saw an increase of 7.6 percent in 2023. This overall financial growth was significantly driven by the supporting arts and cultural production industries, which themselves grew by 6.8 percent, reaching a substantial $873.8 billion. Within this category, information services emerged as a primary contributor to this expansion.
The core arts and cultural production industries also demonstrated strong nominal growth, increasing by 10.6 percent to reach $265.8 billion. Leading contributors to this impressive rise within core industries included performing arts and design services, signaling renewed investment and consumer engagement in live performances and creative design solutions.
State-Level Dynamics: A Patchwork of Growth and Decline
The economic impact of the arts and cultural sector is not uniform across the nation, with significant variations observed at the state level. In 2023, nominal value added in arts and cultural production industries saw an increase in 47 states and the District of Columbia, showcasing a widespread positive trend. However, the magnitude of this growth varied considerably, with percentage changes ranging from a remarkable 14.7 percent in Nevada to a decline of 3.4 percent in Louisiana.
Nevada’s exceptional growth was notably propelled by increases in promoters of performing arts and similar events, publishing, and performing arts companies. This suggests a burgeoning entertainment and creative scene in the state. Conversely, Louisiana experienced a notable decrease, with motion pictures identified as the primary contributor to the decline. This could be attributed to various factors, including shifts in film production incentives or a slowdown in the industry’s output within the state.

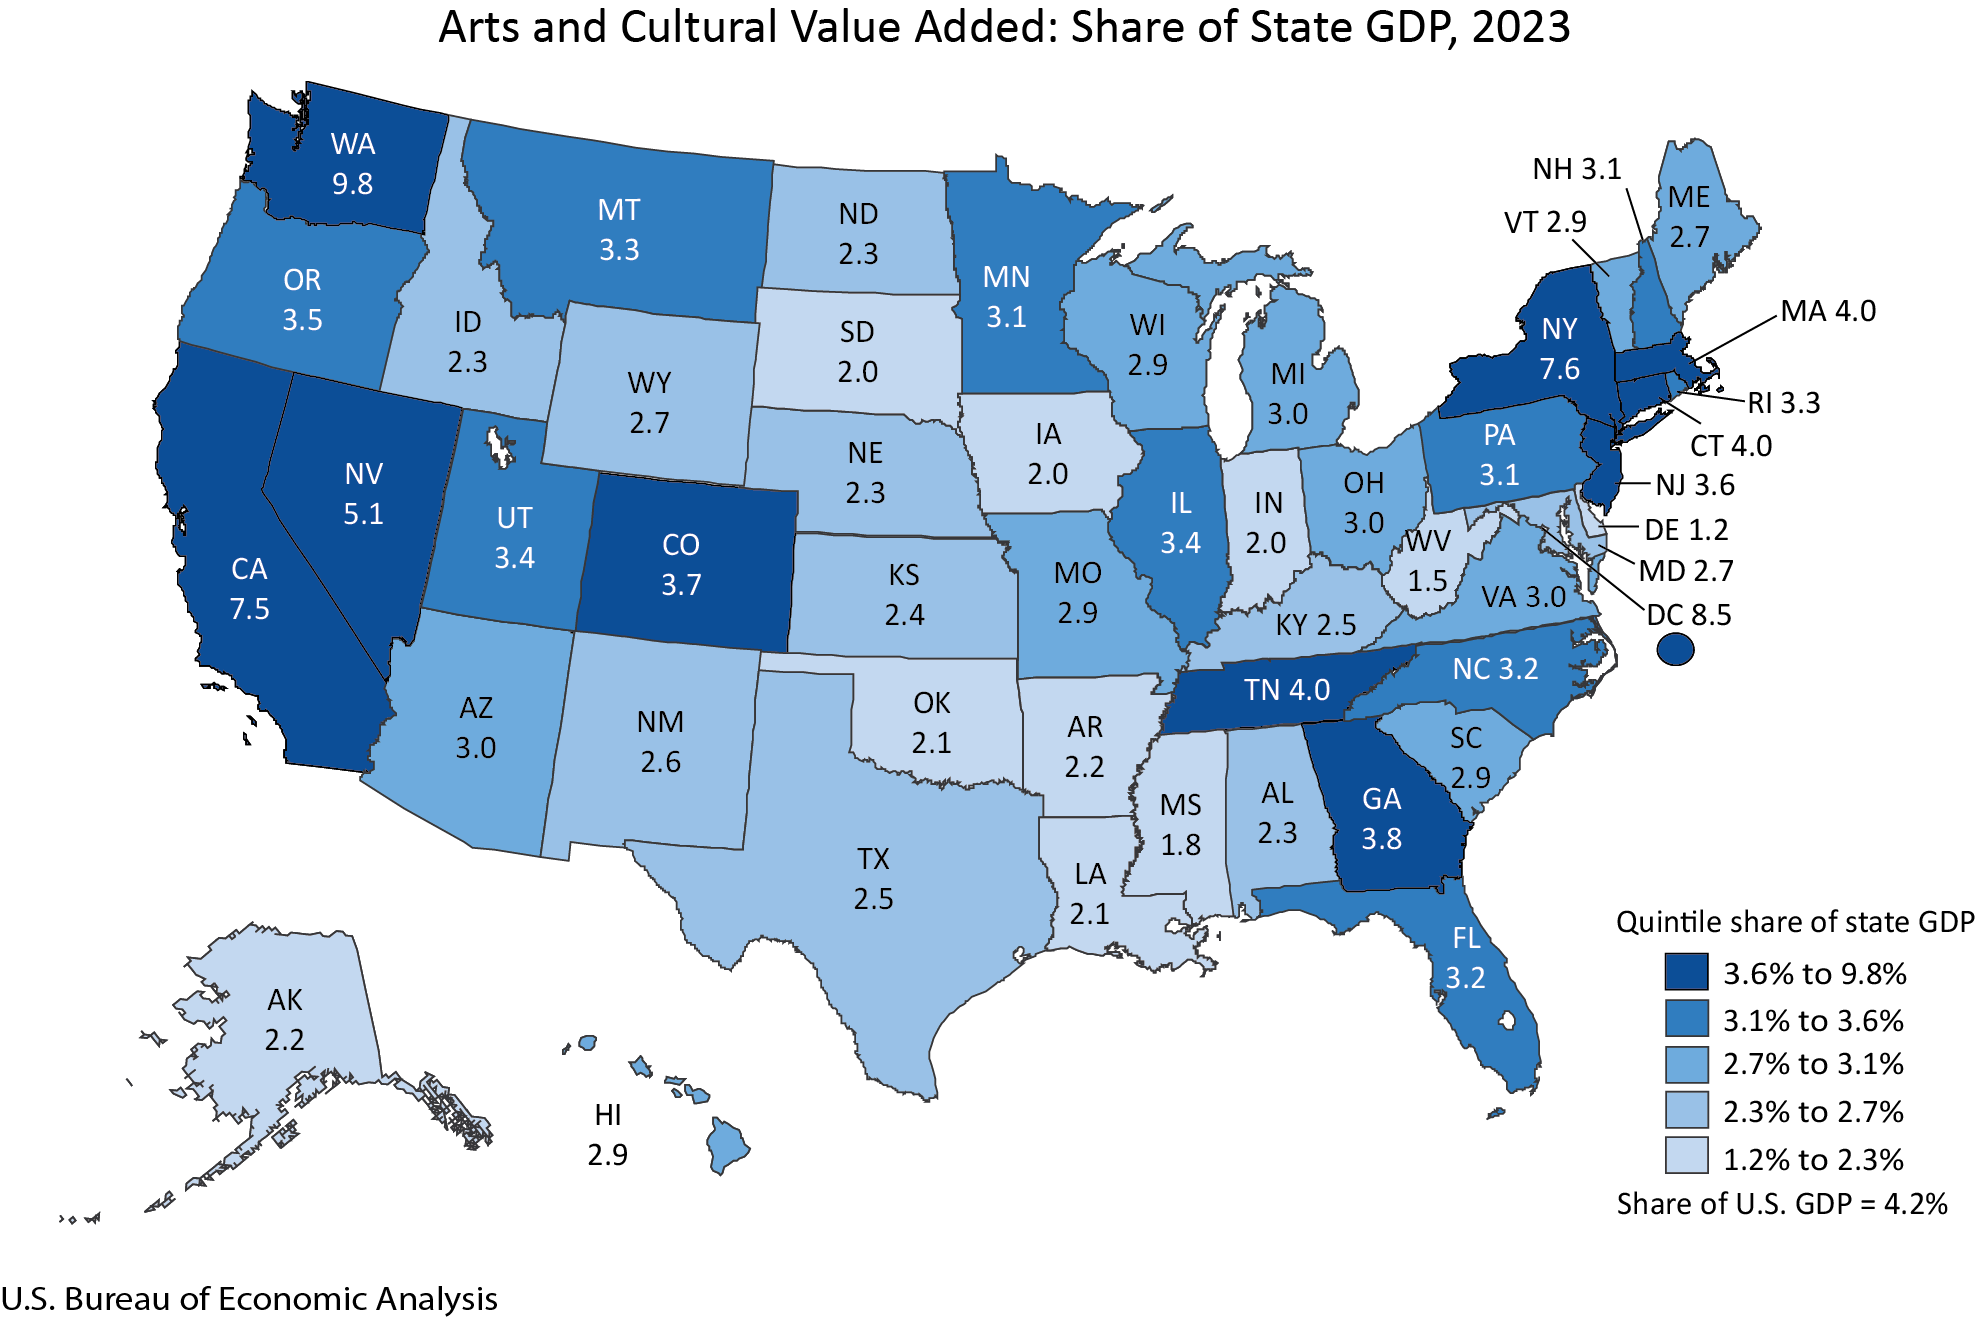
The arts and cultural sector’s contribution to state GDP also exhibited considerable diversity. Washington state led the nation with the arts and cultural sector accounting for 9.8 percent of its total GDP. The District of Columbia, New York, California, and Nevada were the only other jurisdictions where the arts and cultural share of GDP exceeded 5 percent, underscoring their significant reliance on and integration of these industries. For the majority of states, the arts and cultural share of GDP fell within the 2 to 5 percent range.
Leading Industries by State: A Diverse Economic Landscape
The specific industries driving arts and cultural economic activity also varied significantly from state to state. In Washington state, publishing and retail industries were the primary contributors to the sector’s share of total state GDP. The District of Columbia saw government and advertising as key drivers, reflecting the unique economic landscape of the nation’s capital. New York’s robust contribution was bolstered by broadcasting and "other information services," while California’s strength lay in "other information services" and motion pictures. Nevada’s impressive growth was fueled by "other information services" and promoters of performing arts and similar events, highlighting a dynamic blend of digital and live entertainment.
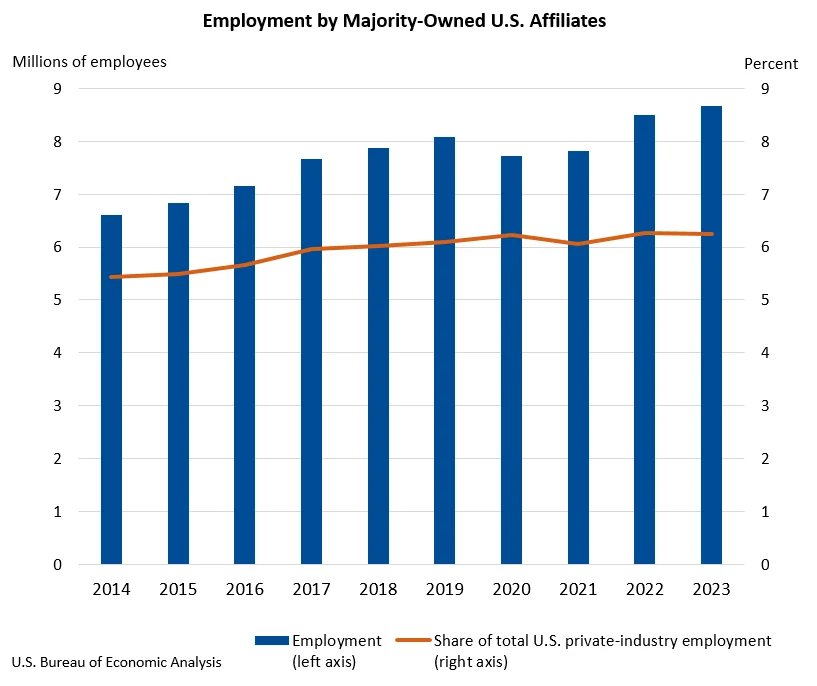
Employment Trends: A Mixed but Growing Picture

Nationwide, arts and cultural employment experienced a modest increase of 0.3 percent in 2023, bringing the total number of jobs in the sector to 5.4 million. While the overall national growth was slight, a more granular look at state-level data reveals a more complex picture. Arts and cultural employment increased in 27 states, with North Carolina leading the pack with a substantial 7.6 percent rise. This growth in North Carolina translated to 167,254 jobs, representing 3.3 percent of all jobs in the state. Government and retail industries were identified as the leading contributors to this employment surge in North Carolina.
Conversely, Hawaii experienced the largest percentage decrease in arts and cultural employment, with a decline of 6.6 percent. The leading contributors to this downturn in Hawaii were the construction and motion picture industries. These fluctuations at the state level suggest that localized economic conditions, industry-specific trends, and regional investment patterns play a crucial role in shaping employment within the arts and cultural sector.
Compensation Growth: A Positive Sign for Workers
In terms of compensation, the arts and cultural sector also showed positive momentum. Nationwide, arts and cultural compensation saw an increase of 3.6 percent in 2023. This growth was broadly distributed, with 43 states and the District of Columbia reporting an increase in compensation for arts and cultural workers. Nevada again stood out with the highest percentage increase in compensation at 12.7 percent, while Georgia experienced the largest decrease at -6.9 percent. This overall rise in compensation can be interpreted as a positive signal for the economic well-being of individuals employed within the sector.

Methodology and Updates: Enhancing Data Accuracy
The release of these comprehensive statistics is the result of ongoing efforts by the BEA to refine and expand its understanding of the arts and cultural economy. The latest report includes updated national-level statistics on output, value added, intermediate inputs, employment, and compensation, covering the period from 1998 to 2022, with new data for 2023. Furthermore, state-level statistics on value added, employment, and compensation have been updated from 2001 to 2022, with new data for 2023.
These updates primarily reflect the incorporation of new and revised source data, as well as the results of the 2024 annual update of BEA’s National and Regional Economic Accounts. For data prior to 2017, updates incorporate the 2023 comprehensive update of BEA’s National and Regional Economic accounts. This continuous refinement of data collection and analysis allows the BEA to provide a more accurate and dynamic portrayal of the arts and cultural production sector, capturing its evolving contributions to the U.S. economy.
Context and Future Outlook
The robust performance of the arts and cultural sector in 2023 occurs against a backdrop of continued economic recovery and adaptation following the disruptions of the COVID-19 pandemic. The sector’s ability to not only recover but to achieve significant growth highlights its inherent resilience and its essential role in the broader economic landscape. The increasing contribution of supporting industries, particularly information services, suggests a growing reliance on digital platforms and technological innovation to disseminate and engage with cultural content.
The sustained growth in value added and compensation indicates a healthy demand for arts and cultural goods and services. This trend could encourage further investment in creative industries, leading to job creation and innovation. The disparity in growth and contribution across states also underscores the importance of tailored economic development strategies that recognize the unique strengths and challenges of each region’s arts and cultural ecosystem.
The National Endowment for the Arts, a key supporter of BEA’s Arts and Cultural Production Satellite Account, has consistently emphasized the economic significance of the arts. This latest data provides compelling evidence to support such claims, offering valuable insights for policymakers, industry leaders, and the public alike.
The next release of the Arts and Cultural Production Satellite Account, featuring data for 2024 at both the national and state levels, is anticipated in March 2026. This ongoing series of reports will continue to be instrumental in tracking the evolution of this vital sector and its multifaceted impact on the American economy.