WASHINGTON D.C. – The U.S. Bureau of Economic Analysis (BEA) today unveiled comprehensive new statistics illuminating the substantial economic footprint of the nation’s outdoor recreation sector. In 2024, this dynamic industry contributed a remarkable $696.7 billion to the current-dollar Gross Domestic Product (GDP), representing a significant 2.4 percent of the total U.S. economy. The release, which includes detailed breakdowns for all 50 states and the District of Columbia, highlights a robust recovery and continued growth in a sector that has become increasingly vital to both national and local economies.
This latest data signifies a pivotal moment for the outdoor recreation economy, underscoring its resilience and its growing importance as a driver of jobs, commerce, and consumer spending. The BEA’s annual update provides an essential benchmark for policymakers, industry leaders, and the public to understand the economic power and geographic distribution of outdoor pursuits.
National Economic Performance and Trends
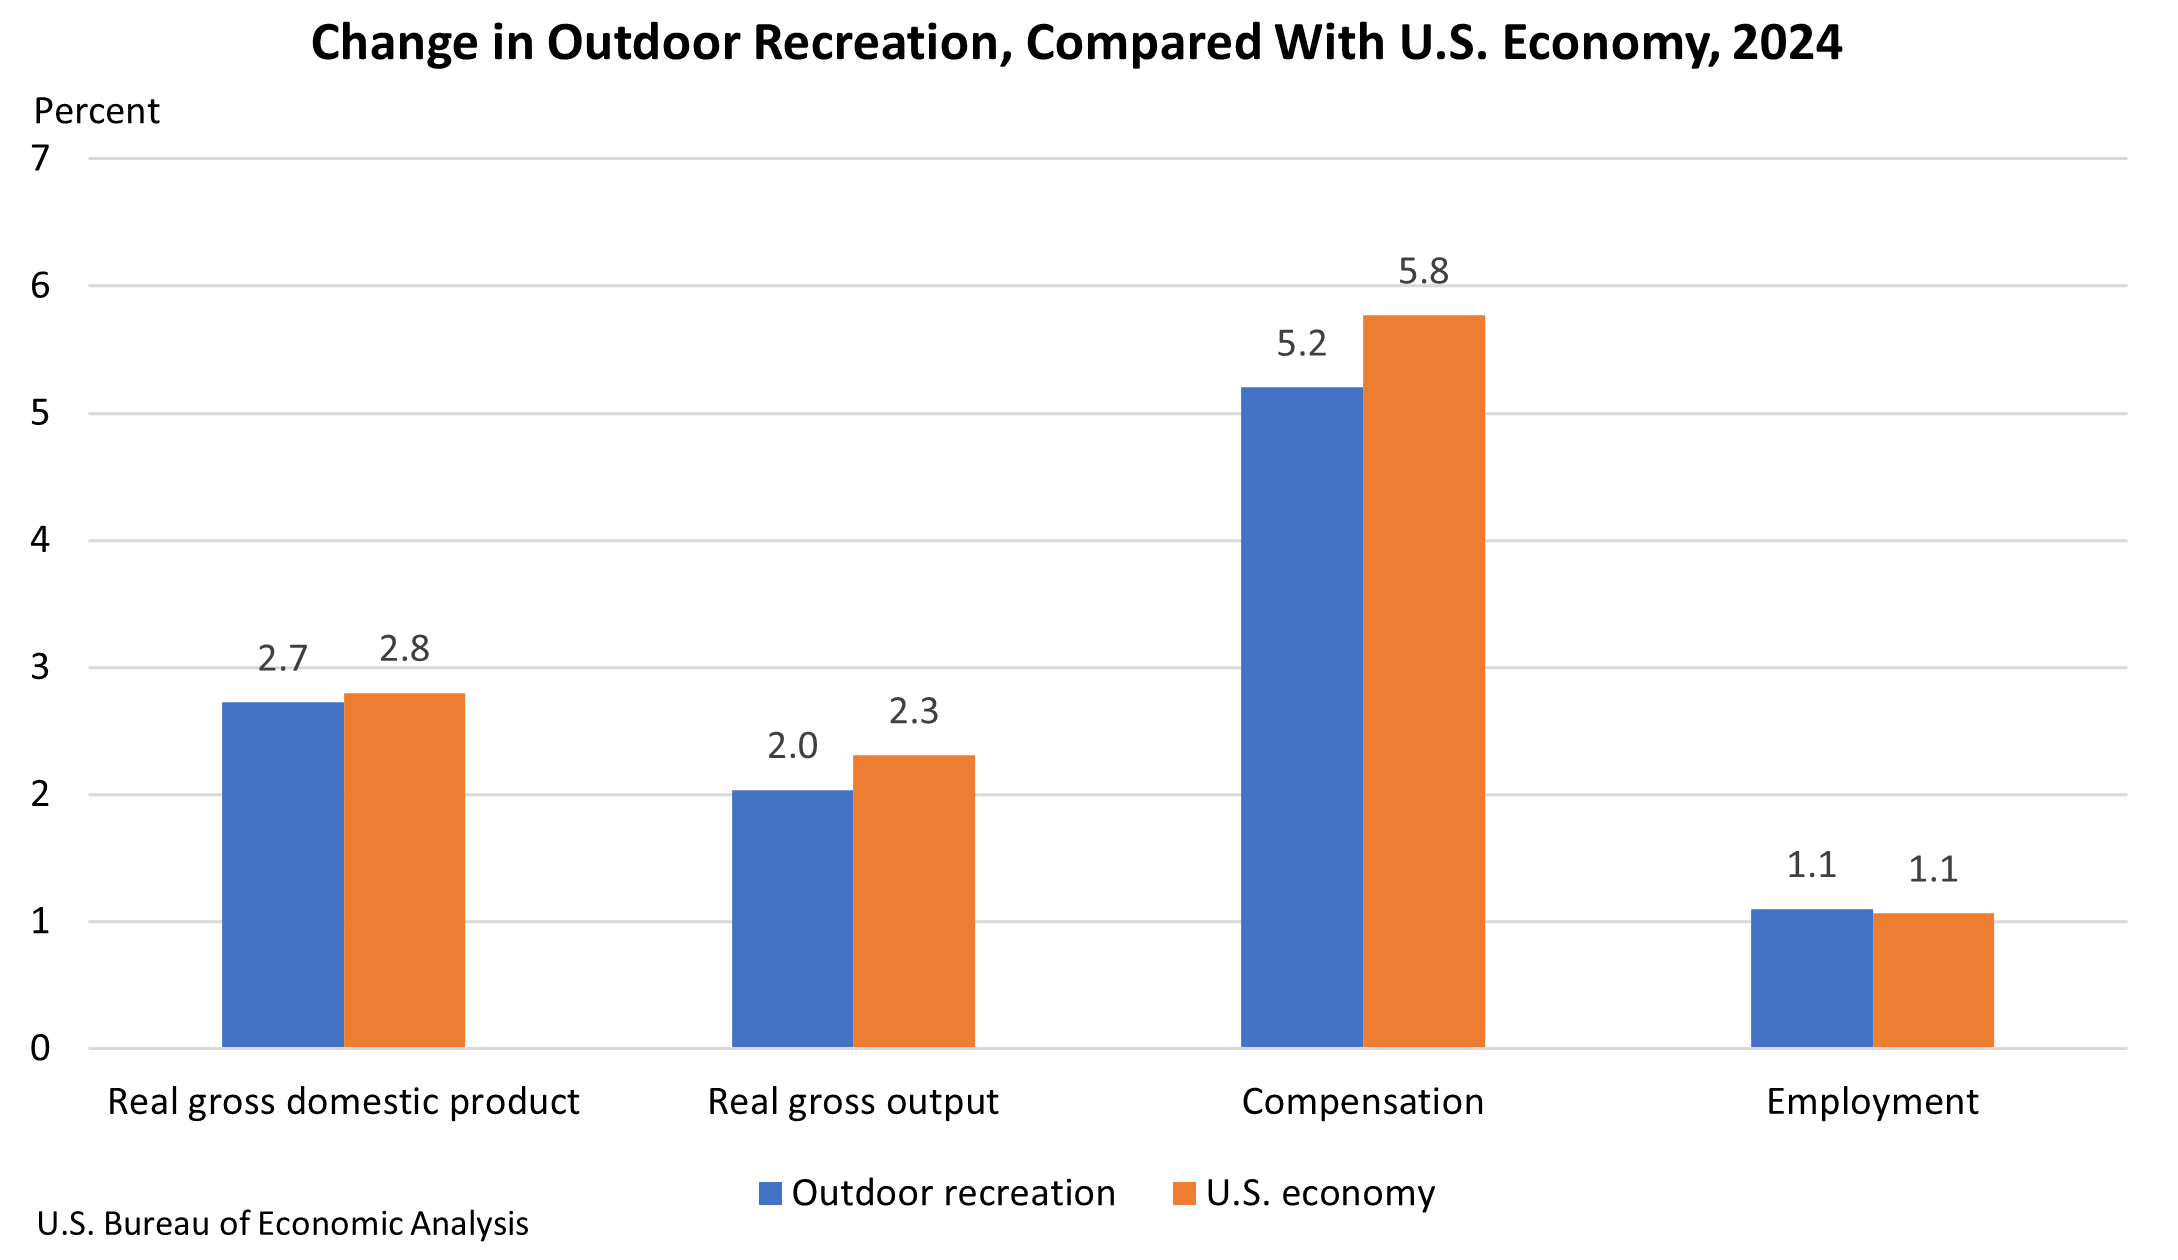
Nationally, the inflation-adjusted ("real") GDP for the outdoor recreation economy saw a notable increase of 2.7 percent in 2024. While this represents a slight deceleration from the robust 5.3 percent growth observed in 2023, it still outpaces the overall U.S. economy’s growth of 2.8 percent for the year. This sustained growth trajectory indicates that outdoor recreation activities continue to capture significant consumer interest and investment, even as the broader economic landscape navigates various challenges.
The BEA’s findings also reveal positive trends in employment and compensation within the sector. Overall outdoor recreation employment climbed by 1.1 percent in 2024, demonstrating a healthy expansion of job opportunities. Compensation within the industry saw an even more impressive surge, increasing by 5.2 percent, suggesting that workers in the outdoor recreation sector are experiencing growing earnings. Real gross output for the sector also registered a positive gain of 2.0 percent, reflecting an increase in the total value of goods and services produced.
State-Level Variations and Economic Impact
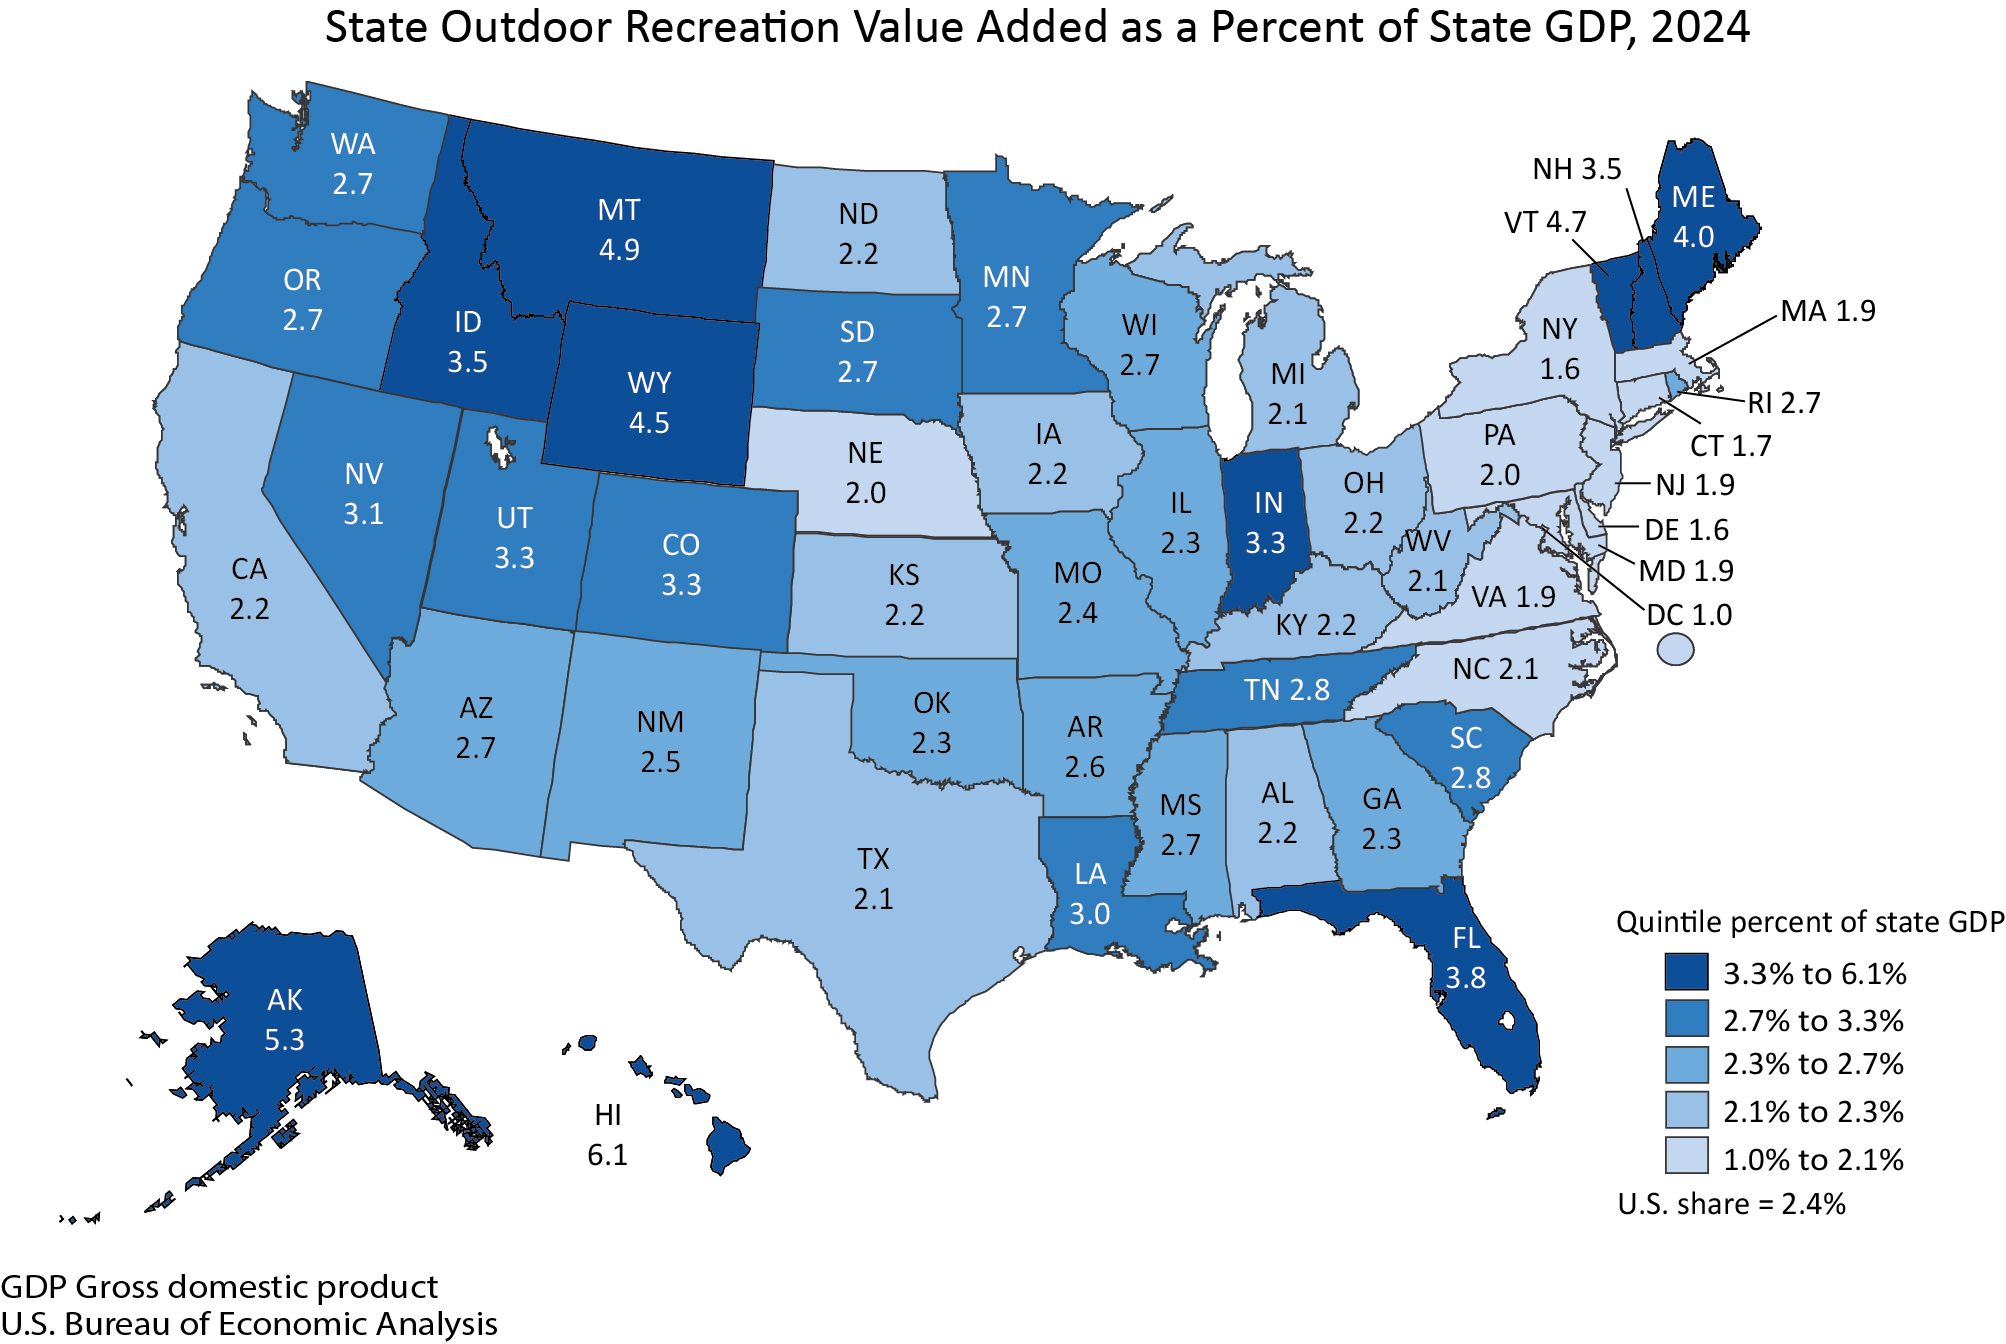
The economic impact of outdoor recreation varies considerably across the United States, reflecting diverse geographic features, recreational preferences, and economic structures. Hawaii emerged as the leader in terms of outdoor recreation’s share of state GDP, accounting for an impressive 6.1 percent. This strong performance is likely attributable to the state’s unique natural beauty, its appeal as a tourist destination, and the prevalence of water-based and nature-oriented activities.
In contrast, the District of Columbia registered the lowest contribution at 1.0 percent of its state GDP. While this figure might seem modest, it’s important to consider the District’s unique economic profile, which is heavily influenced by government and professional services.
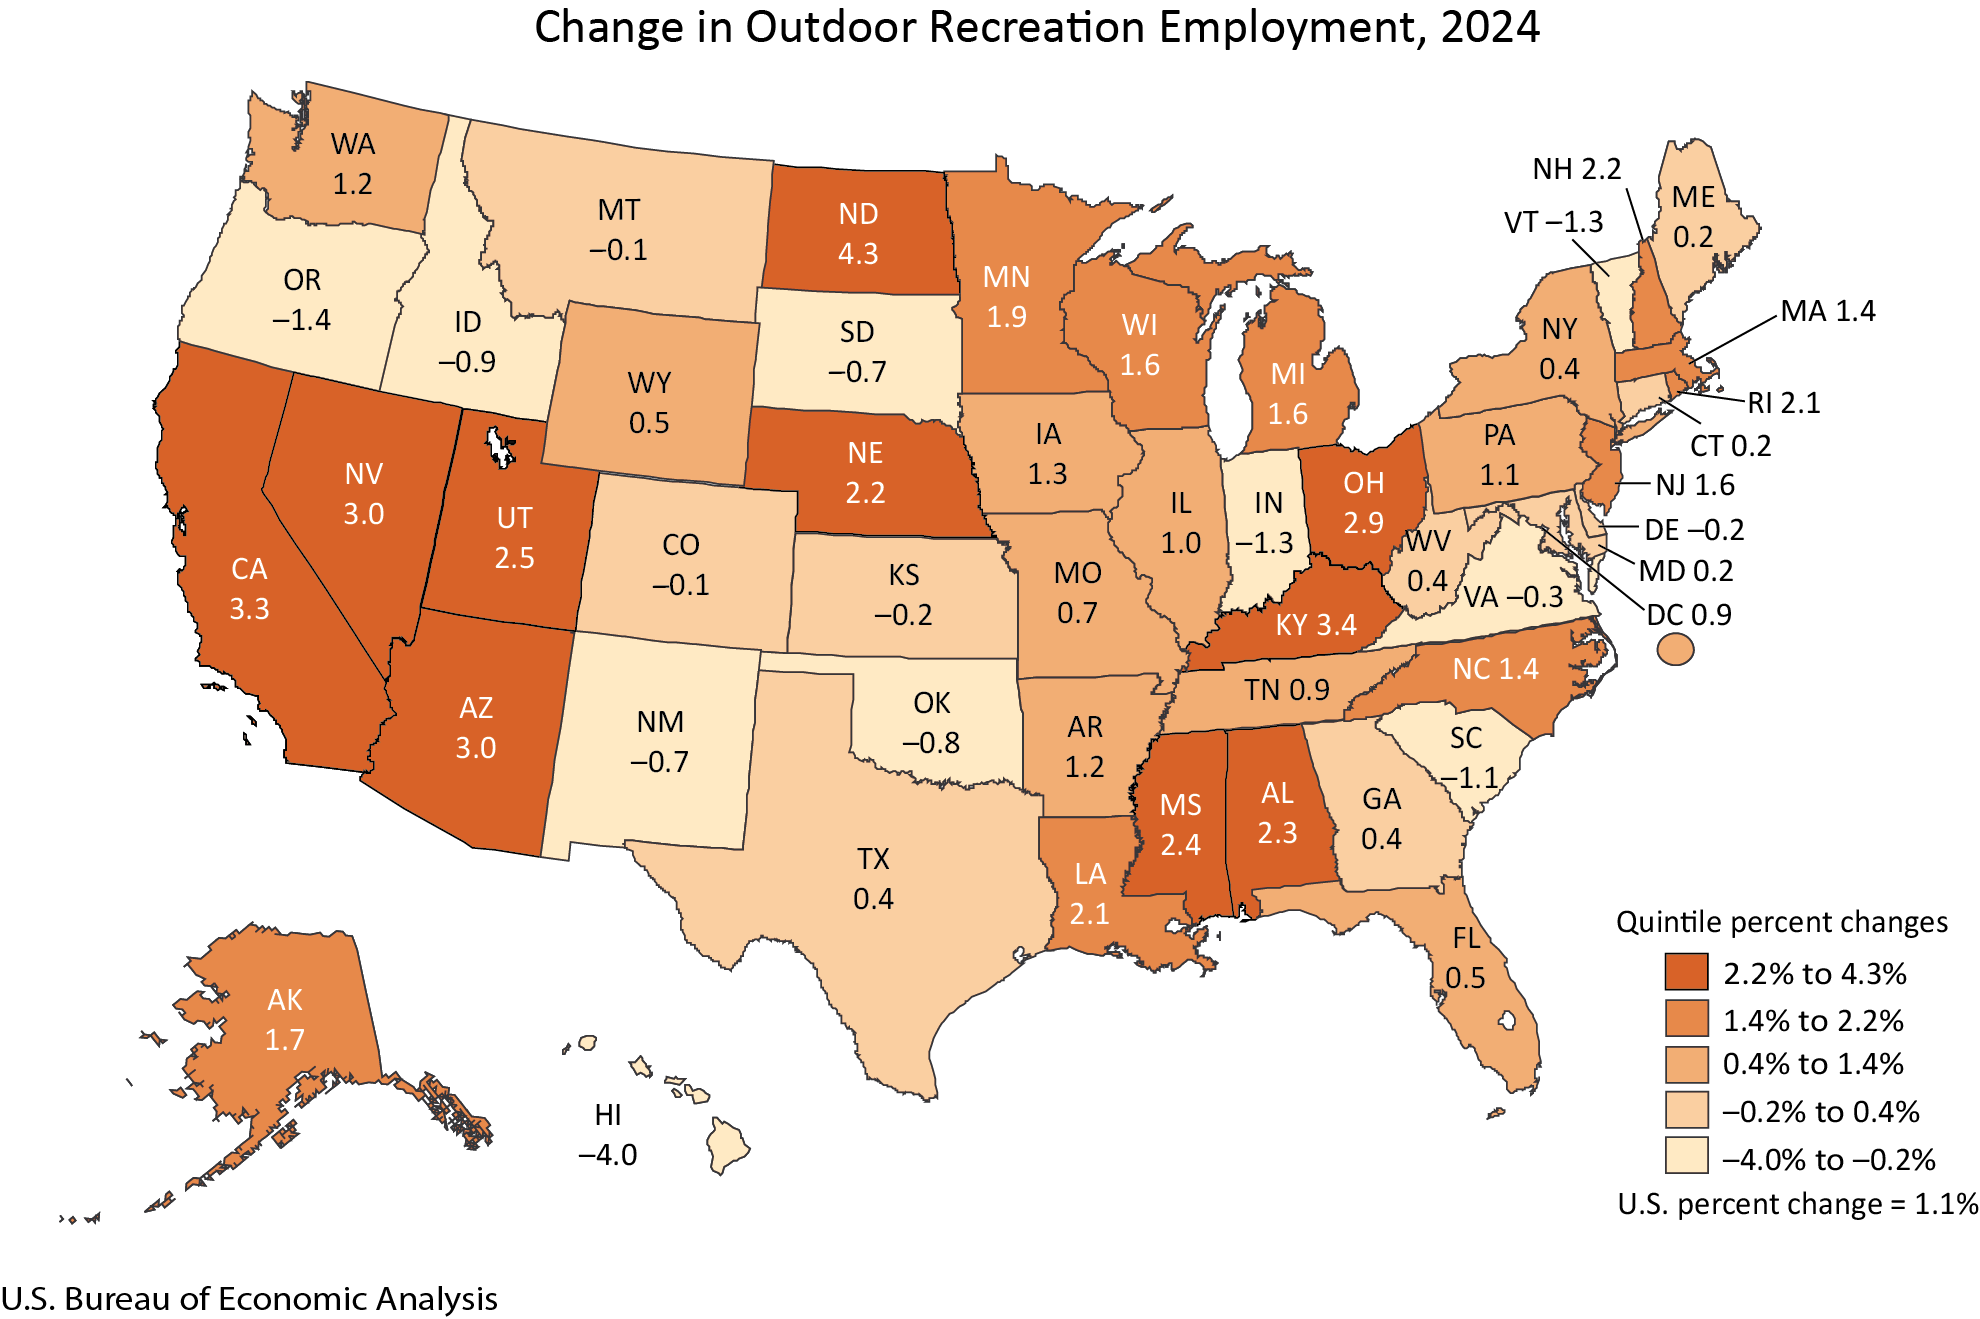
The BEA’s interactive tables offer a granular look at employment changes at the state level. In 2024, outdoor recreation employment saw an increase in 36 states and the District of Columbia. North Dakota led the nation with a remarkable 4.3 percent surge in outdoor recreation employment. This growth in a state known for its expansive natural landscapes and growing interest in outdoor pursuits highlights the sector’s potential even in less traditionally recognized recreational hubs. Conversely, Hawaii experienced a decline of 4.0 percent in outdoor recreation employment, a figure that warrants further investigation given its high overall contribution to the state’s GDP. This could reflect shifts in tourism patterns or specific industry dynamics within the state.
Deconstructing Outdoor Recreation: Activities and Industries
The BEA categorizes outdoor recreation activities into three broad groups:
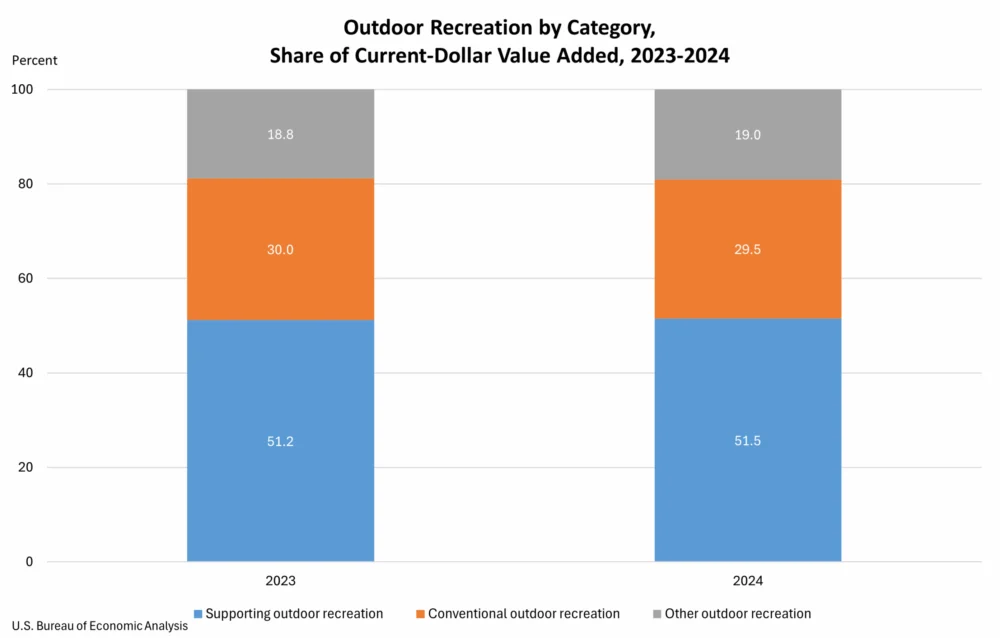
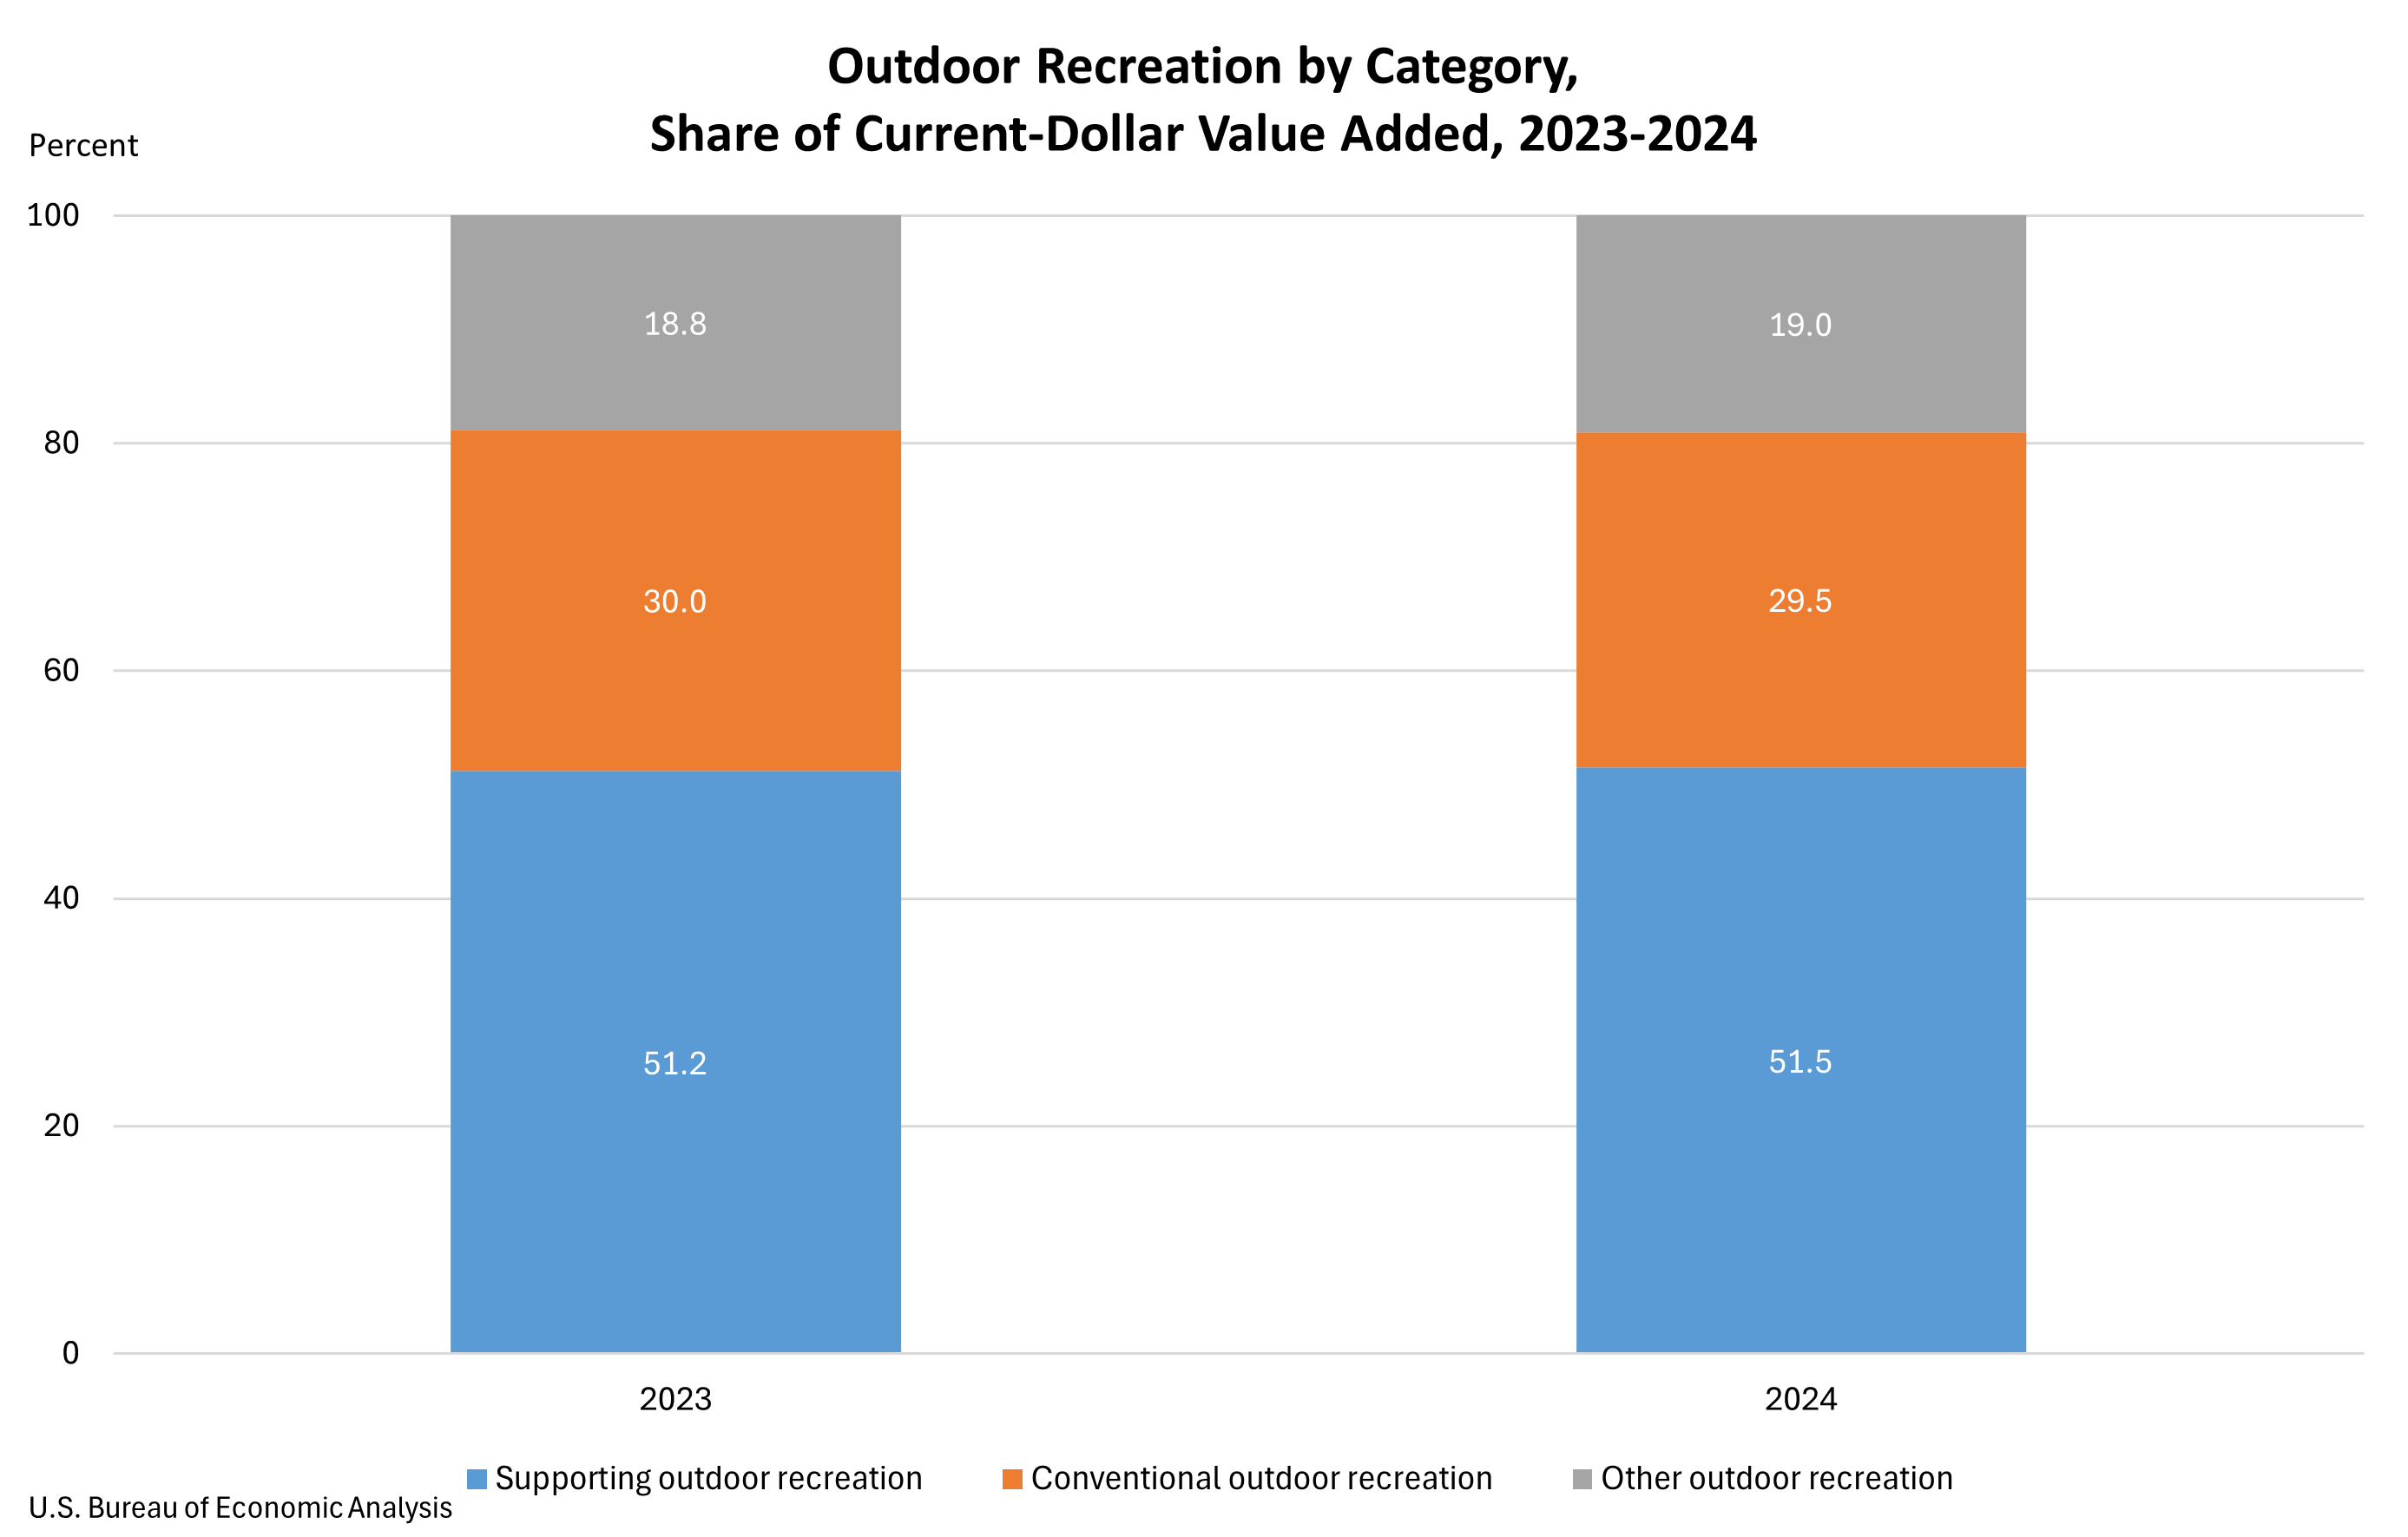
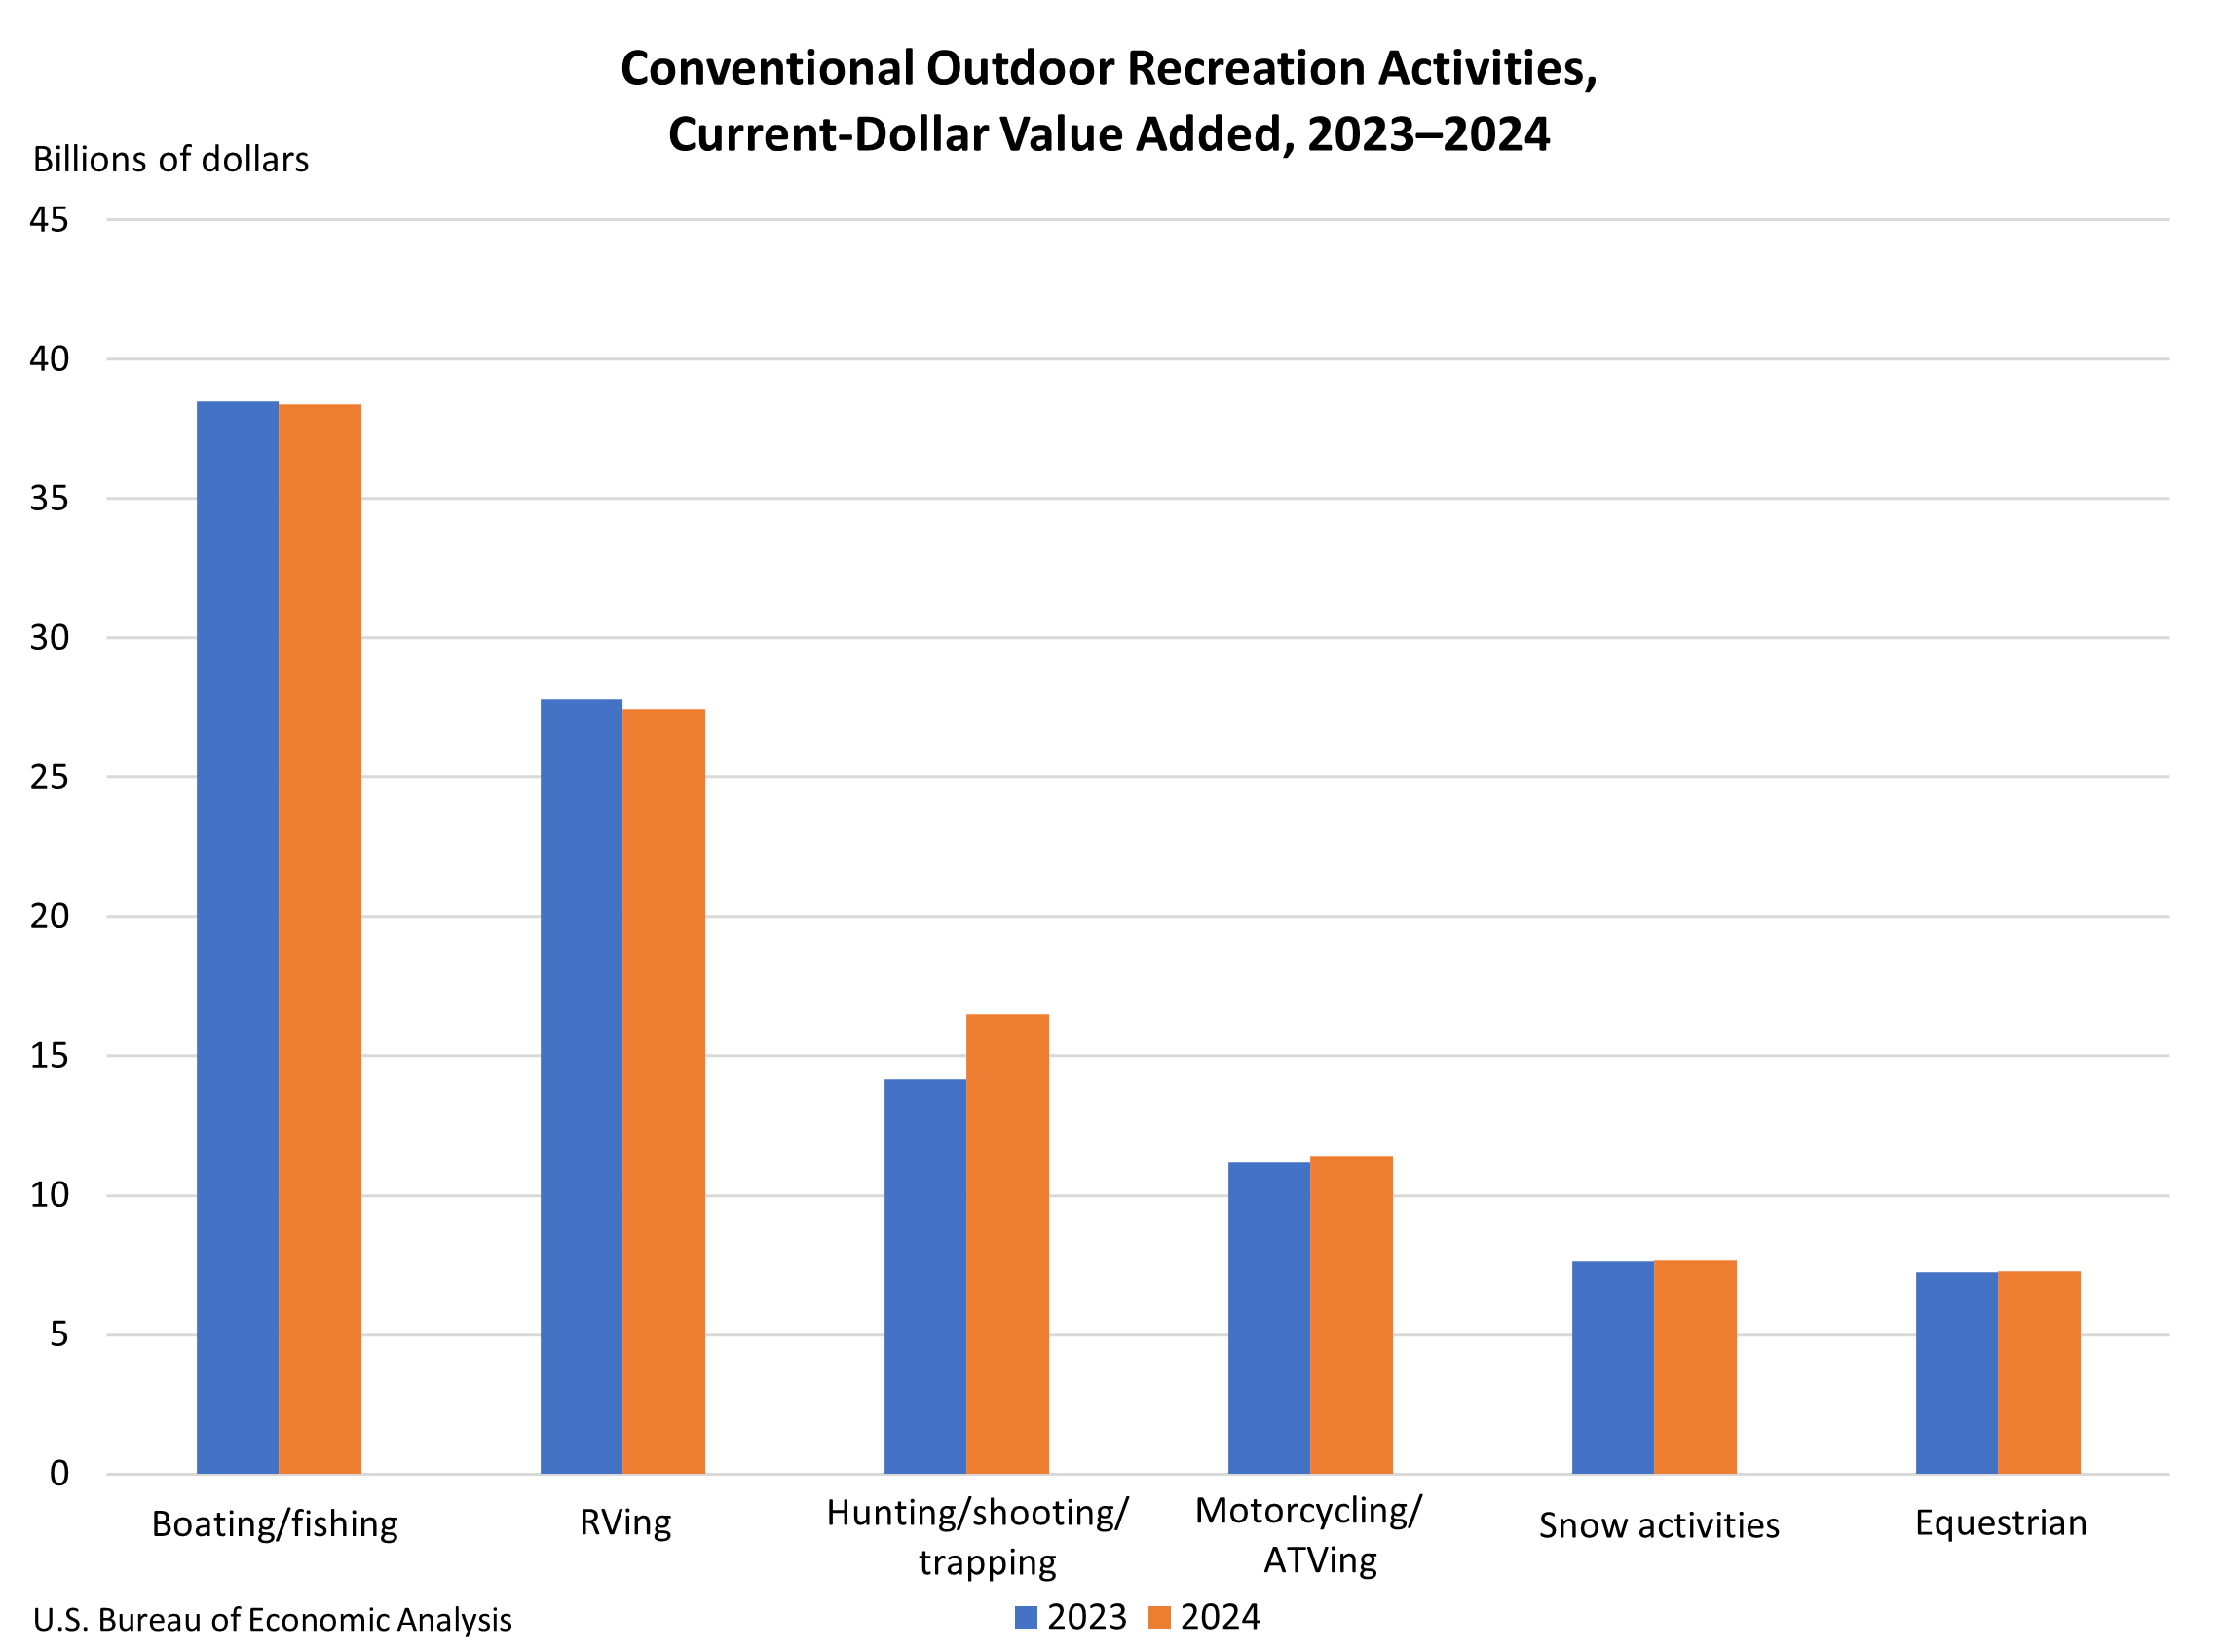
- Conventional Activities: These encompass traditional pursuits such as bicycling, boating, hiking, hunting, fishing, camping, and climbing. In 2024, this category accounted for 29.5 percent of the U.S. outdoor recreation value added, a slight decrease from 30.0 percent in 2023.
- Other Outdoor Recreation: This category includes activities like gardening, outdoor concerts, festivals, and other events that take place outdoors. In 2024, "other outdoor recreation" made up 19.0 percent of value added, a marginal increase from 18.8 percent in the previous year.
- Supporting Activities: This is the largest and most encompassing category, accounting for 51.5 percent of value added in 2024. It includes essential elements like construction of recreational facilities, travel and tourism infrastructure, local transportation, and government expenditures related to parks and public lands. Growth in this category was primarily driven by travel and tourism, fueled by increased spending on transportation, accommodation, and dining.
The slight shift in proportions between these categories suggests a dynamic evolution within the outdoor recreation landscape. While conventional activities remain a core component, the increasing dominance of supporting activities, particularly travel and tourism, underscores the sector’s interconnectedness with broader economic drivers. This indicates that investments in infrastructure, accessibility, and hospitality services are crucial for maximizing the economic benefits of outdoor recreation.
Industry Contributions to the Outdoor Recreation Economy
The BEA’s industry-level data provides critical insights into which sectors are most instrumental in driving the outdoor recreation economy.
-
Arts, Entertainment, Recreation, Accommodation, and Food Services: This broad industry group emerged as the largest contributor to U.S. outdoor recreation value added in 2024, accounting for a substantial $174.4 billion, or 25.0 percent of the total. This sector is directly linked to the consumer experience of outdoor activities, encompassing everything from amusement parks and museums to hotels, restaurants, and recreational facilities. At the state level, this industry was the dominant contributor in 23 states and the District of Columbia. California, Florida, and New York led the nation in value added from this sector, reflecting their status as major tourist destinations and population centers.
-
Retail Trade: The second-largest contributor to the national outdoor recreation economy was retail trade, generating $169.1 billion, or 24.3 percent of value added. This sector encompasses businesses selling goods directly to consumers, including sporting goods stores, outdoor apparel retailers, and general merchandise stores that cater to outdoor enthusiasts. Retail trade was the leading industry in 24 states, with California, Texas, and Florida again showing the largest contributions. This highlights the significant role of consumer spending on gear and equipment in fueling the outdoor recreation economy.
-
Manufacturing: The manufacturing sector played a vital role as the third-largest contributor, accounting for $91.3 billion, or 13.1 percent of value added. This category includes the production of outdoor equipment such as recreational vehicles, boats, sporting goods, and apparel. Manufacturing was the primary industry contributor in two states, Indiana and Louisiana. Texas, California, and Indiana posted the largest contributions from manufacturing to the outdoor recreation economy, underscoring the importance of domestic production in supplying the goods that enable outdoor pursuits.
Annual Updates and Data Refinement
The BEA’s release incorporates updated estimates for the years 2020 through 2023, reflecting the incorporation of new and revised source data from the 2025 annual update of the National Economic Accounts. This annual revision process ensures that the statistics remain current and accurately reflect evolving economic conditions. The updates include advancements in the National Income and Product Accounts and the Industry Economic Accounts, providing a more precise picture of national economic activity. Similarly, state-level statistics have been refined by incorporating the 2025 annual update of the Regional Economic Accounts and updated regional source data. This commitment to data accuracy and timeliness is crucial for informed decision-making by stakeholders.
Implications for Policymakers and Industry
The robust performance of the outdoor recreation economy, as detailed by the BEA, carries significant implications for various stakeholders. For policymakers, these figures underscore the economic importance of investing in public lands, trails, parks, and related infrastructure. Supporting the growth of the outdoor recreation sector can lead to job creation, economic diversification, and enhanced quality of life for communities across the nation. Furthermore, understanding the geographical distribution of this economic activity can help tailor local and state-level economic development strategies.
For businesses operating within or serving the outdoor recreation sector, these statistics offer valuable market intelligence. The continued growth in supporting activities, particularly travel and tourism, suggests opportunities for expansion in hospitality, transportation, and experience-based offerings. The strong performance of retail and manufacturing also points to sustained demand for outdoor equipment and apparel.
The BEA’s data serves as a powerful testament to the enduring appeal of outdoor activities and their substantial contribution to the American economy. As the nation continues to prioritize health, wellness, and connection with nature, the outdoor recreation economy is poised for continued growth and innovation, solidifying its position as a vital engine of economic prosperity. The BEA has indicated that the next release of Outdoor Recreation Economic Statistics for the U.S. and States will be in the Fall of 2026, covering the 2025 data.