Washington D.C. – The U.S. Bureau of Economic Analysis (BEA) today unveiled its comprehensive annual statistics for 2024, offering a detailed look at real personal consumption expenditures (PCE), real personal income, and regional price parities (RPPs) across all 50 states and the District of Columbia. This release provides crucial insights into the economic performance and price dynamics at the state level, serving as a vital resource for policymakers, businesses, and researchers. The data reveals a widespread increase in consumer spending and personal income, though with notable variations among states, underscoring the diverse economic landscapes within the United States.
National Economic Trends Reflected in State-Level Data
The national economy experienced a robust expansion in real personal consumption expenditures in 2024, with an overall increase of 2.9 percent. This growth outpaced the national PCE price index, which rose by 2.6 percent. This indicates that consumers were not only spending more but also seeing their purchasing power increase in real terms. Current-dollar PCE saw a more substantial rise of 5.6 percent nationally, highlighting the impact of inflation on the nominal value of consumer spending.
Similarly, real personal income for the nation grew by 2.9 percent in 2024. This growth also surpassed the national PCE price index, suggesting that, on average, Americans’ incomes kept pace with or slightly exceeded inflation. Current-dollar personal income experienced a 5.6 percent increase nationwide, reflecting the combined effect of real income growth and price level adjustments. These national trends provide a broad context for understanding the state-specific figures released by the BEA.
Real Personal Consumption Expenditures: A Tale of 48 States and D.C.
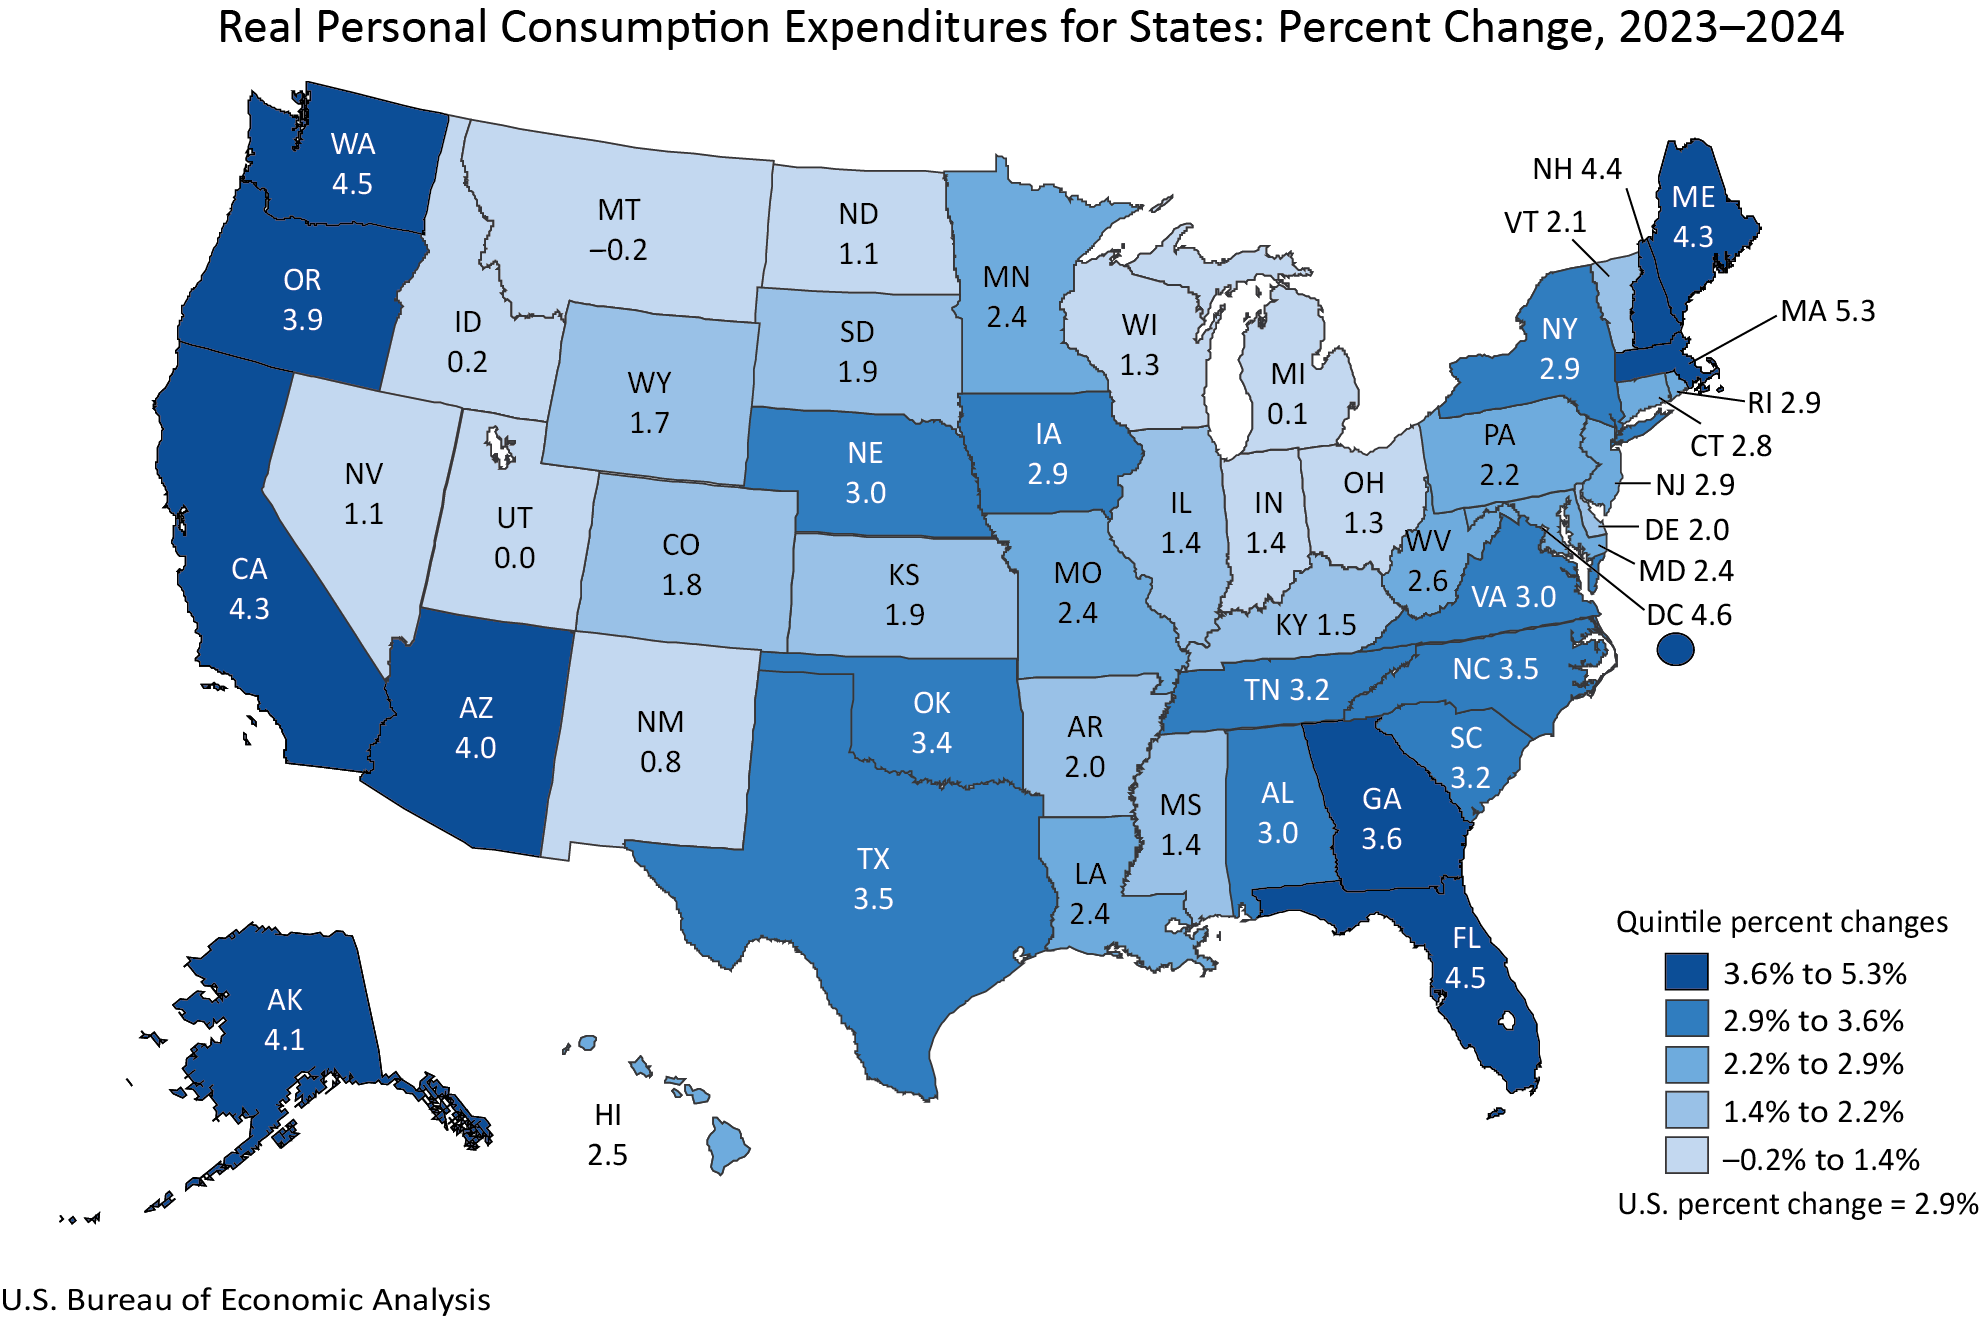
In 2024, the upward trajectory of consumer spending was a dominant theme, with 48 states and the District of Columbia witnessing an increase in real personal consumption expenditures. This broad-based growth signals a healthy consumer sector across a significant portion of the nation. The magnitude of this growth varied considerably, with Massachusetts leading the pack with an impressive 5.3 percent surge in real PCE. This strong performance in Massachusetts suggests a particularly vibrant consumer market, potentially driven by factors such as a robust job market, high disposable incomes, or increased demand for goods and services.
Conversely, Montana was the only state to experience a slight contraction in real PCE, with a decrease of 0.2 percent. While a marginal decline, it stands in contrast to the widespread gains observed elsewhere and may warrant further investigation into specific economic drivers within the state.
The BEA calculates real PCE by adjusting current-dollar estimates with regional price parities and the national PCE price index. This methodology ensures that the figures reflect actual changes in the volume of goods and services consumed, accounting for both inflation and regional cost-of-living differences. The data visually represented by accompanying charts (though not directly embedded here, their content is described) further illustrate these percentage changes, highlighting the spatial distribution of consumer spending growth across the United States.
Real Personal Income Growth: California Leads, North Dakota Sees a Dip
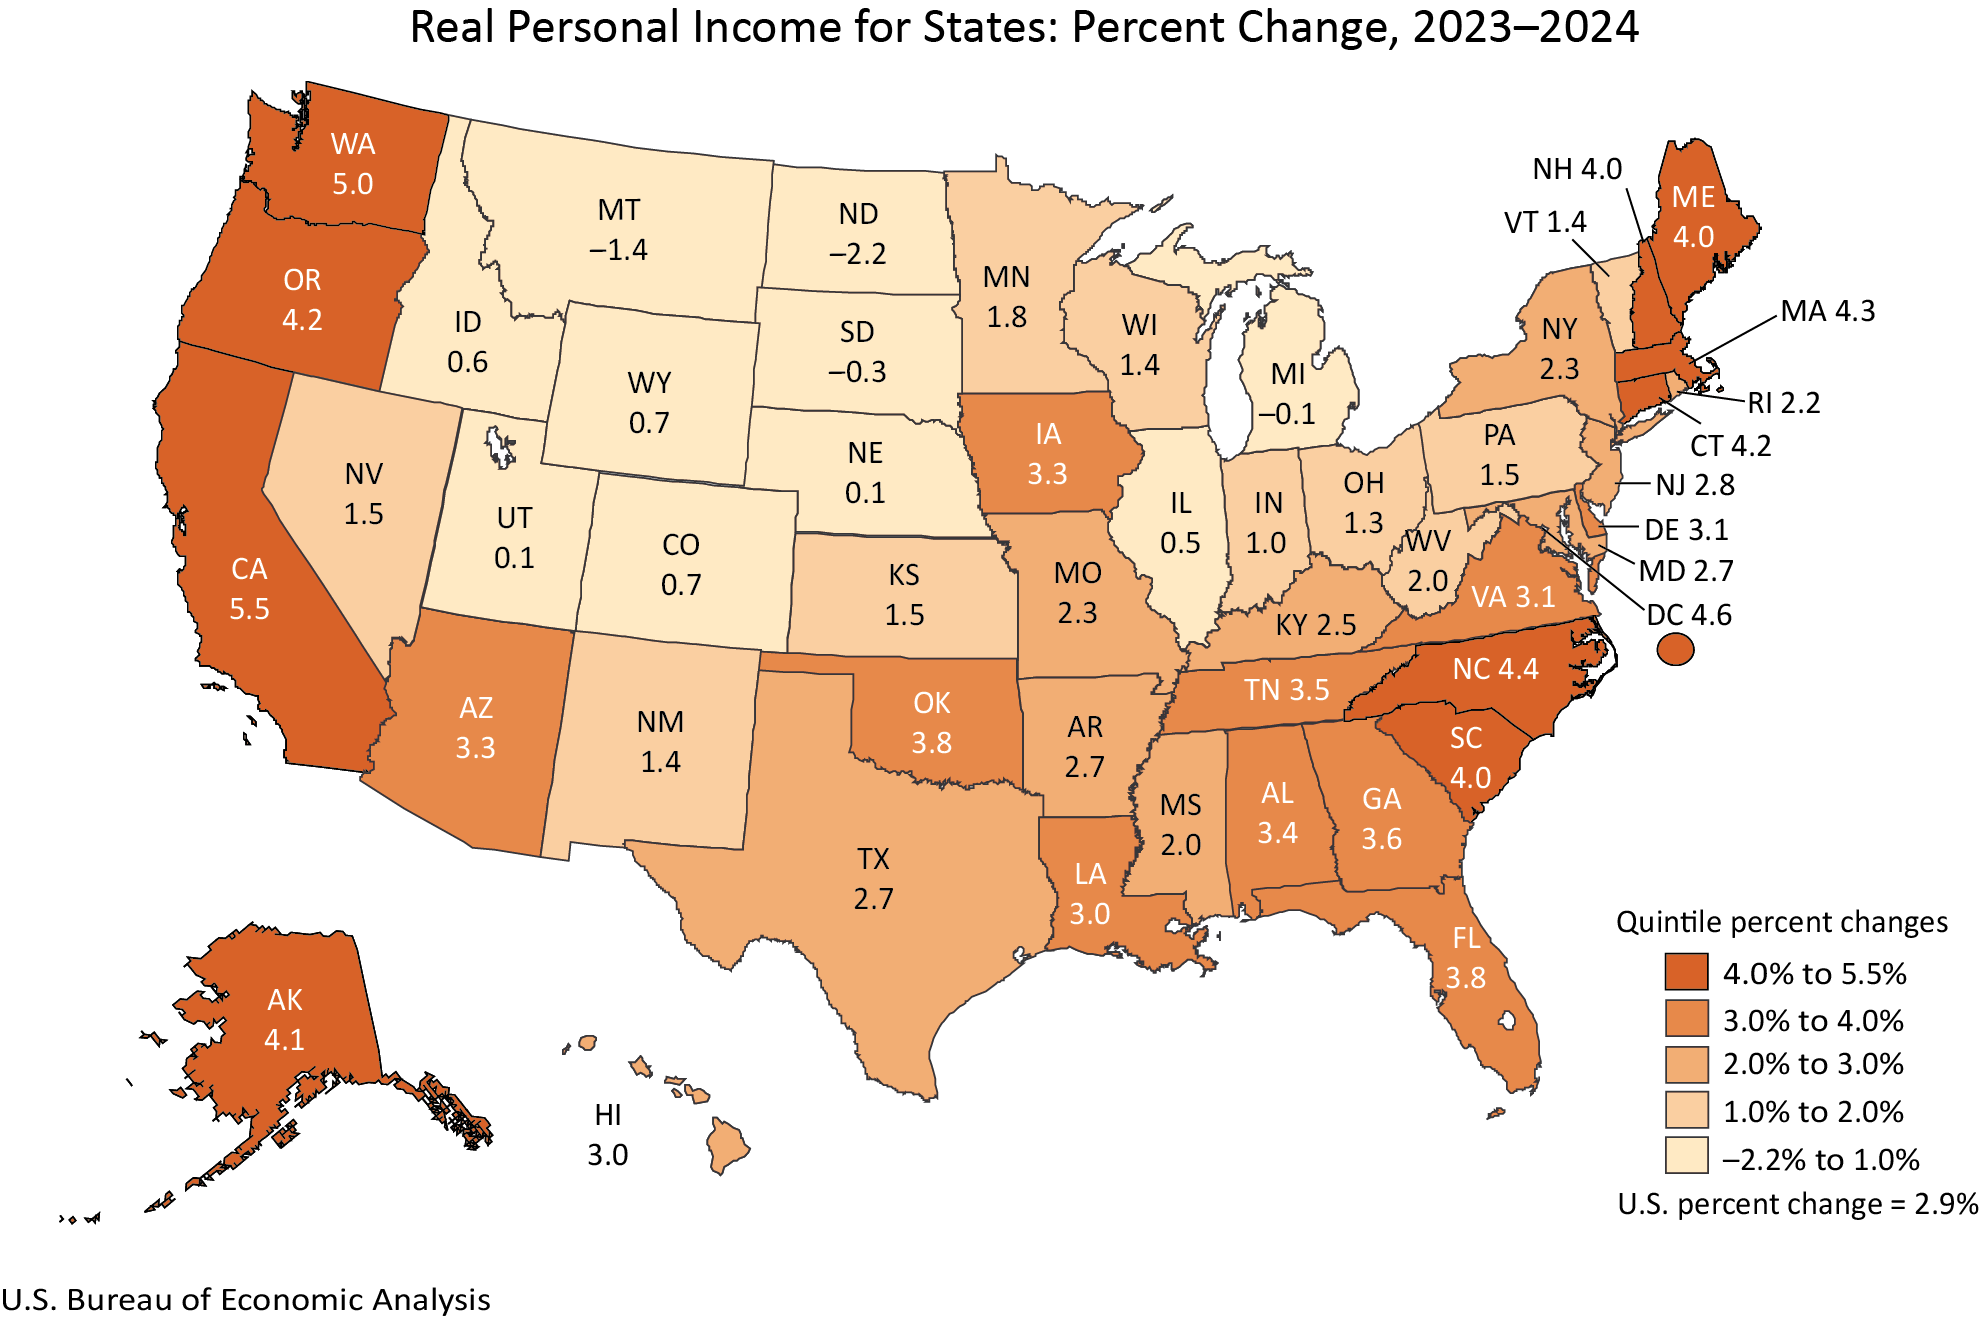
The landscape of personal income also showed a positive trend for the majority of the country, with 46 states and the District of Columbia reporting an increase in real personal income in 2024. California emerged as the top performer in real personal income growth, with an impressive 5.5 percent increase. This substantial rise in California’s real income points to a strong economic environment, potentially fueled by its dominant technology sector, robust employment growth, and significant contributions from various service industries.
On the other end of the spectrum, North Dakota experienced a decline of 2.2 percent in real personal income. This decrease, while notable, occurred in a state that has historically seen fluctuations tied to its energy sector. Understanding the specific economic conditions that led to this dip in North Dakota will be crucial for regional economic analysis.
Similar to PCE, real personal income figures are derived by adjusting current-dollar income with regional price parities and the national PCE price index. This approach provides a more accurate picture of the change in the purchasing power of individuals’ income. The national increase of 2.9 percent in real personal income, with current-dollar income rising 5.6 percent, sets the backdrop against which these state-level performances are measured. The fact that current-dollar income grew faster than the national PCE price index (2.6 percent) signifies a real increase in the economic well-being of many Americans.
Regional Price Parities: Understanding the Cost of Living
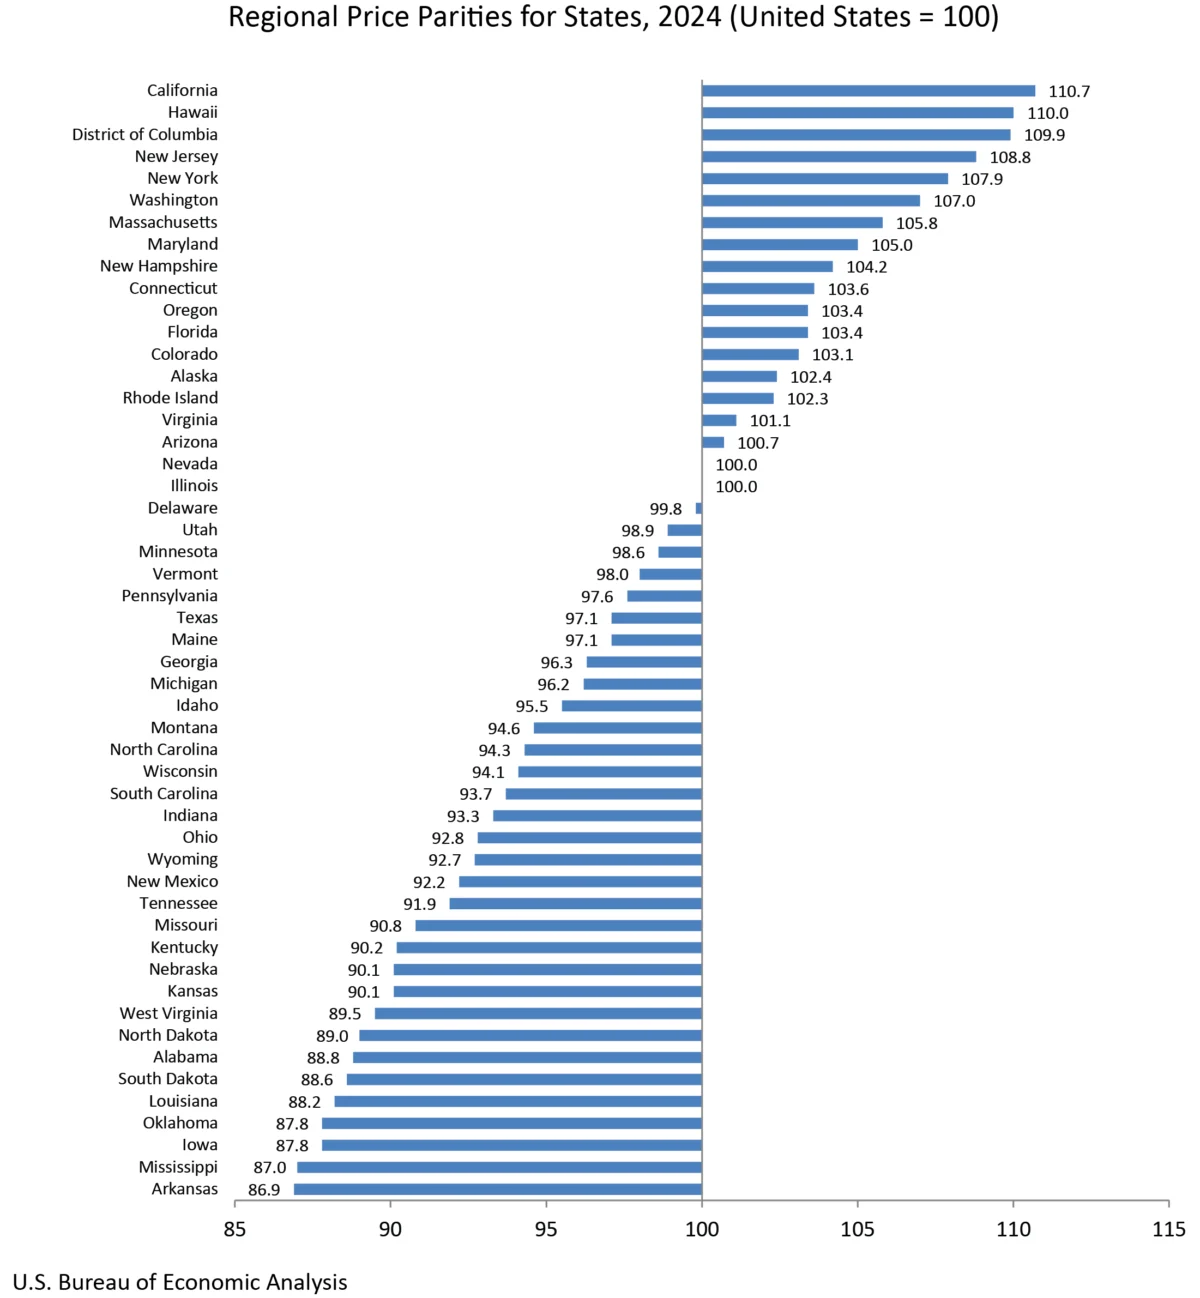
Regional Price Parities (RPPs) are a critical component of the BEA’s analysis, as they measure the differences in price levels across states for a given year, expressed as a percentage of the national average. These indices are vital for understanding the true purchasing power of income and expenditures. For instance, a higher RPP indicates a higher cost of living in that region compared to the national average.
The BEA’s "all items RPP," which encompasses all consumption goods and services including housing rents, is particularly informative. Housing rents are identified as a primary driver of disparities in RPPs, reflecting the significant variation in housing costs across different parts of the United States. For example, states with high housing costs will generally have higher RPPs, meaning that a dollar earned in those states buys less than a dollar earned in a state with lower housing costs. This is crucial context when interpreting the real income and PCE data, as it adjusts for these cost-of-living differences.
The BEA also makes metropolitan area RPP statistics available on its website, offering an even more granular view of price level variations within states. This information is invaluable for businesses making location decisions and for individuals assessing the affordability of different regions.
Revisions and Updates: Enhancing Data Accuracy
A significant aspect of this release is the extensive revision of annual estimates for real PCE and real personal income by state, covering the period from 2008 to 2023. These revisions incorporate newly available and updated source data, which are more comprehensive and detailed than previously available. This meticulous process ensures that the BEA’s statistics remain as accurate and reflective of the evolving economic landscape as possible.
These revisions are also synchronized with the annual updates of the National Income and Product Accounts (NIPA) and Gross Domestic Product (GDP) by industry statistics. This alignment ensures consistency across various BEA datasets, providing a more cohesive and reliable economic picture. The BEA’s commitment to updating its data reflects the dynamic nature of economic activity and the need for continuous refinement of statistical measures.
New Per Capita Estimates and a Shift in Data Presentation
In addition to the state-level aggregates, the BEA has released new estimates of real per capita PCE and real per capita personal income for 2024. These per capita figures, calculated using U.S. Census Bureau population data for 2020 through 2024, offer a valuable perspective on the average economic well-being of individuals within each state. Per capita measures are often used to compare living standards and economic productivity across different regions.
A notable change in the presentation of data accompanying this release is the discontinuation of statistics for metropolitan statistical areas and their metropolitan and nonmetropolitan portions for real PCE and real personal income. While RPPs will continue to be published for state and local areas, the detailed breakdown of PCE and personal income by metropolitan area is no longer being produced. This strategic decision aims to streamline data dissemination and focus resources on core state-level reporting. The BEA has provided an FAQ for users seeking more information on this change.
Furthermore, the BEA has updated its presentation of data tables. Previously embedded within news releases, these tables are now exclusively available through the BEA’s online Interactive Data Application. This move is intended to reduce duplication, enhance efficiency, and provide users with more flexibility. The Interactive Data Application allows for customizable data queries, full time series access, and downloads in various formats, including PDF, Excel, and CSV. This digital-first approach aligns with modern data consumption trends and empowers users to explore and analyze economic data more effectively.
Looking Ahead: The Future of State Economic Data
The BEA has also provided a clear roadmap for future releases. The next comprehensive update for real personal consumption expenditures, real personal income, and RPPs by state is scheduled for December 10, 2026, at 8:30 a.m. EST, which will supersede the 2024 data with the 2025 statistics. This regular cadence of data releases ensures that stakeholders have access to timely and relevant economic information. For historical data that may be superseded by these updates, users can access the BEA’s Data Archive.
The BEA’s ongoing commitment to providing detailed and timely economic statistics at the state level is instrumental for understanding the diverse economic dynamics at play across the United States. The 2024 data release, with its focus on PCE, personal income, and regional price parities, offers a granular view of economic performance and cost-of-living variations, empowering informed decision-making for a wide array of users. The strategic changes in data presentation and the discontinuation of certain metropolitan-level statistics reflect an ongoing effort by the BEA to adapt to the evolving needs of data users and to optimize the dissemination of crucial economic information.