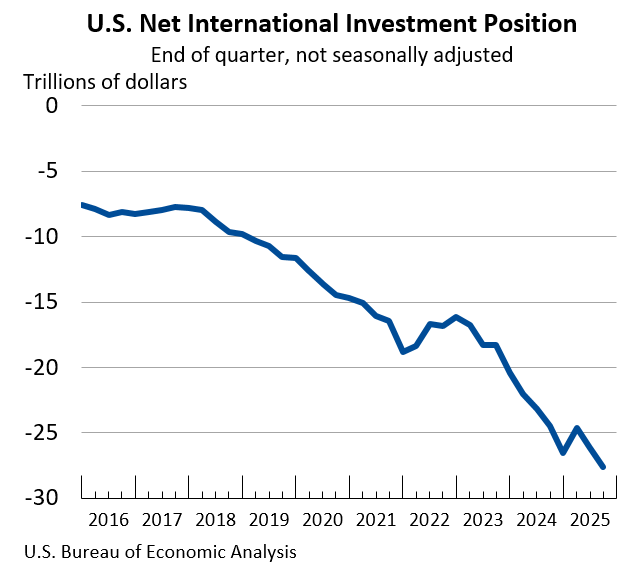
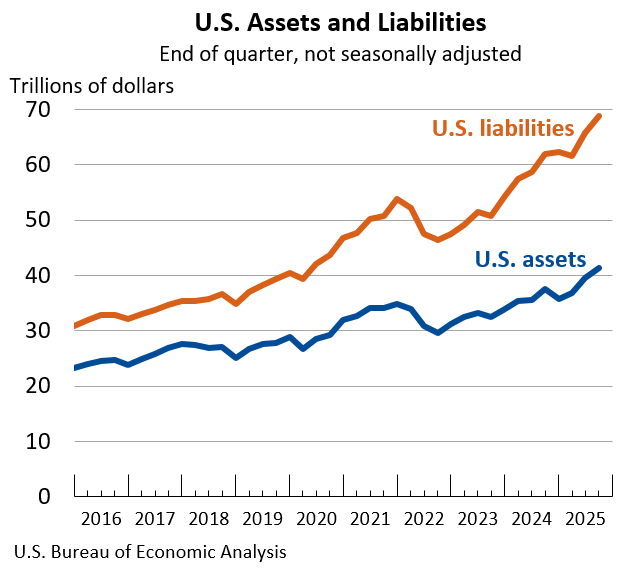
The United States’ net international investment position, a critical indicator of the nation’s financial standing with the rest of the world, registered a deficit of $27.61 trillion at the close of the third quarter of 2025. This figure, released by the U.S. Bureau of Economic Analysis (BEA), represents the difference between the value of foreign financial assets held by U.S. residents and the value of U.S. financial liabilities held by foreign residents. The latest data shows total U.S. assets abroad at $41.27 trillion, while liabilities to foreign entities stood at a substantial $68.89 trillion. This marks a notable deterioration from the revised figure of a negative $26.16 trillion recorded at the end of the second quarter of 2025.
Deepening Deficit Driven by Market Valuations
The widening of the net international investment position by $1.46 trillion between the second and third quarters of 2025 was primarily influenced by non-transactional factors, specifically price and exchange-rate changes, which accounted for a $1.07 trillion negative impact. Net financial transactions, reflecting actual flows of investment, contributed a smaller negative figure of $386.1 billion to this shift.
A key driver of this valuation adjustment was the performance of equity markets. U.S. stock prices experienced a more significant increase than their foreign counterparts during the third quarter. While this might seem positive for domestic holdings, it had the effect of inflating the market value of U.S. liabilities held by foreigners more than it boosted the value of U.S. assets abroad. Specifically, price changes alone resulted in a $1.06 trillion decrease in the net investment position. This dynamic highlights the sensitivity of the net investment position to global market fluctuations, even in the absence of substantial new investment flows.
U.S. Assets See Growth, Fueled by Equity and Direct Investments
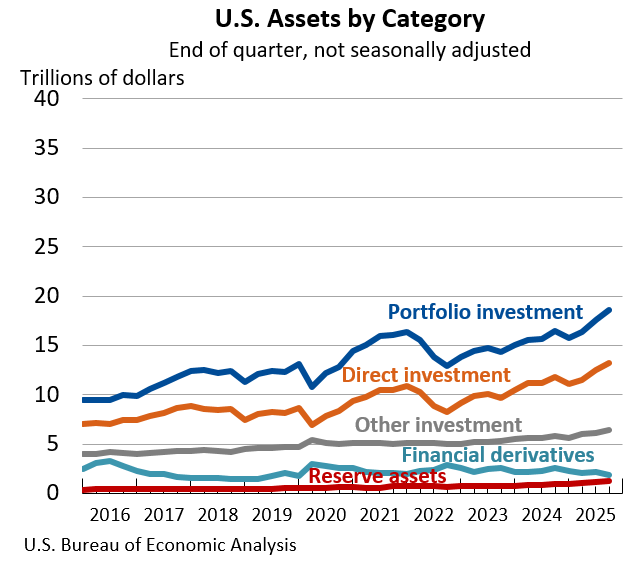
Despite the overall widening of the deficit, U.S. assets held abroad experienced a considerable increase, rising by $1.71 trillion to reach a total of $41.27 trillion by the end of the third quarter. This growth was largely propelled by a surge in the market value of both portfolio investment and direct investment assets. Foreign stock price increases contributed $863.0 billion to the valuation of portfolio assets, while direct investment assets saw an increase of $609.4 billion, reflecting the rising value of U.S. companies and their overseas operations.
Beyond financial derivatives, which experienced a decline, all other major categories of U.S. assets abroad saw an increase in value during the third quarter. This broad-based appreciation suggests a generally positive performance of U.S. holdings in international markets, albeit outpaced by the valuation increases in foreign holdings of U.S. assets.
Liabilities Surge Amidst Foreign Appetite for U.S. Equities and Debt
Conversely, U.S. liabilities to foreign entities climbed by a more substantial $3.17 trillion, reaching a cumulative total of $68.89 trillion at the close of the third quarter. This significant expansion was also heavily influenced by market valuations, with U.S. stock price increases significantly boosting the value of foreign-held portfolio investment and direct investment liabilities. Portfolio liabilities, which include foreign ownership of U.S. stocks and bonds, increased by $1.39 trillion, while direct investment liabilities, representing foreign ownership of U.S. businesses, rose by $1.20 trillion.
Adding to the rise in liabilities were net financial transactions amounting to $797.8 billion. This figure primarily reflects robust foreign purchases of U.S. equity securities and long-term debt instruments, indicating sustained international investor confidence in the U.S. financial markets and economy. Similar to assets, all major categories of U.S. liabilities, with the exception of financial derivatives, expanded during the quarter.
Revisions to Second-Quarter Data
The BEA also released revised estimates for the second quarter of 2025. The preliminary estimate for the net international investment position at the end of the second quarter was a negative $26.14 trillion. This has been revised to a negative $26.16 trillion, a marginal adjustment of $20 billion. U.S. assets were reported at $39.56 trillion in both preliminary and revised estimates, while U.S. liabilities saw a slight upward revision from $65.71 trillion to $65.72 trillion. These revisions underscore the ongoing process of refining economic data as more comprehensive information becomes available.
Background and Context: The International Investment Position
The U.S. international investment position is a crucial metric for understanding the nation’s financial health and its role in the global economy. It provides a snapshot of the United States’ financial claims on foreigners and foreigners’ claims on the United States at a specific point in time. A negative net international investment position, as is the case for the U.S., indicates that foreigners hold more U.S. financial assets than U.S. residents hold foreign financial assets.
Historically, the U.S. has maintained a negative net international investment position for several decades, a trend attributed to factors such as persistent trade deficits, which lead to an accumulation of foreign claims on the U.S., and the U.S. dollar’s role as a global reserve currency, making U.S. assets attractive to foreign investors. While a negative position is not inherently detrimental, a rapidly deteriorating or excessively large deficit can raise concerns about long-term financial stability and the nation’s ability to service its foreign obligations.
The components of the net international investment position include direct investment, portfolio investment, financial derivatives, other investment (such as loans and currency), and reserve assets. Changes in the position are driven by two primary forces: financial transactions (net flows of investment) and other changes in position, which encompass valuation changes due to price and exchange rate fluctuations, as well as other adjustments.
Implications of the Widening Deficit
The persistent and widening negative net international investment position has several potential implications. From a macroeconomic perspective, it suggests that the U.S. is a net borrower from the rest of the world. This reliance on foreign capital can make the U.S. economy more susceptible to global financial shocks and changes in investor sentiment. A significant outflow of capital or a sharp depreciation of the U.S. dollar could have ripple effects on asset prices, interest rates, and overall economic growth.
Furthermore, the increasing level of foreign-held U.S. liabilities, particularly in equity and debt securities, means that a larger portion of U.S. corporate profits and future debt servicing obligations will flow to foreign entities. While foreign investment is essential for funding domestic economic activity and capital formation, a substantial and growing level of foreign ownership of U.S. assets warrants careful monitoring.
However, it is also important to consider the strengths of the U.S. economy that attract such investment. The U.S. remains a global leader in innovation, technology, and financial markets, offering attractive opportunities for foreign investors. The deep and liquid nature of U.S. financial markets provides a stable environment for investment, and the rule of law offers a degree of security for asset holders. The fact that U.S. assets also hold significant value abroad indicates the global reach and influence of American businesses and investors.
BEA Modernization: A New Era for Data Dissemination
In anticipation of future reporting, the BEA announced significant changes to its news release dissemination strategy. Beginning in March 2026, the quarterly U.S. international transactions and international investment position accounts will be consolidated into a single news release. This integration aims to provide a more holistic view of the U.S. economy’s engagement with the global landscape and will accelerate the availability of international investment position statistics by eliminating the publication of two separate releases.
Furthermore, as part of its ongoing modernization efforts, the BEA will transition from including detailed statistical tables within the news release body. Instead, the consolidated release will feature dynamic links to the BEA’s Interactive Data Application. This move is intended to reduce redundancy, enhance efficiency, and direct data users to the most comprehensive and flexible data tables available. These customizable tables will offer full time series and can be downloaded in various formats, including PDF, Excel, and CSV.
Upcoming Releases
The next release of U.S. International Transactions and Investment Position data is scheduled for March 25, 2026, at 8:30 a.m. EDT, covering the 4th quarter and the full year of 2025. Subsequent releases for 2026 are scheduled for June 24 (1st Quarter and Annual Update), September 24 (2nd Quarter), and December 18 (3rd Quarter). These future releases will provide ongoing insights into the evolution of the U.S. international investment position and its underlying components.