The U.S. Bureau of Economic Analysis (BEA) today released its comprehensive third-quarter 2025 statistics, revealing a landscape of widespread economic expansion across all 50 states and the District of Columbia. The data, encompassing July, August, and September of 2025, indicates a significant uptick in both gross domestic product (GDP) and personal income, painting a picture of a resilient and growing national economy. This release also included crucial updates to previously reported state-level economic data, offering a more refined understanding of economic performance throughout the year.
National Economic Performance: A Broad-Based Surge
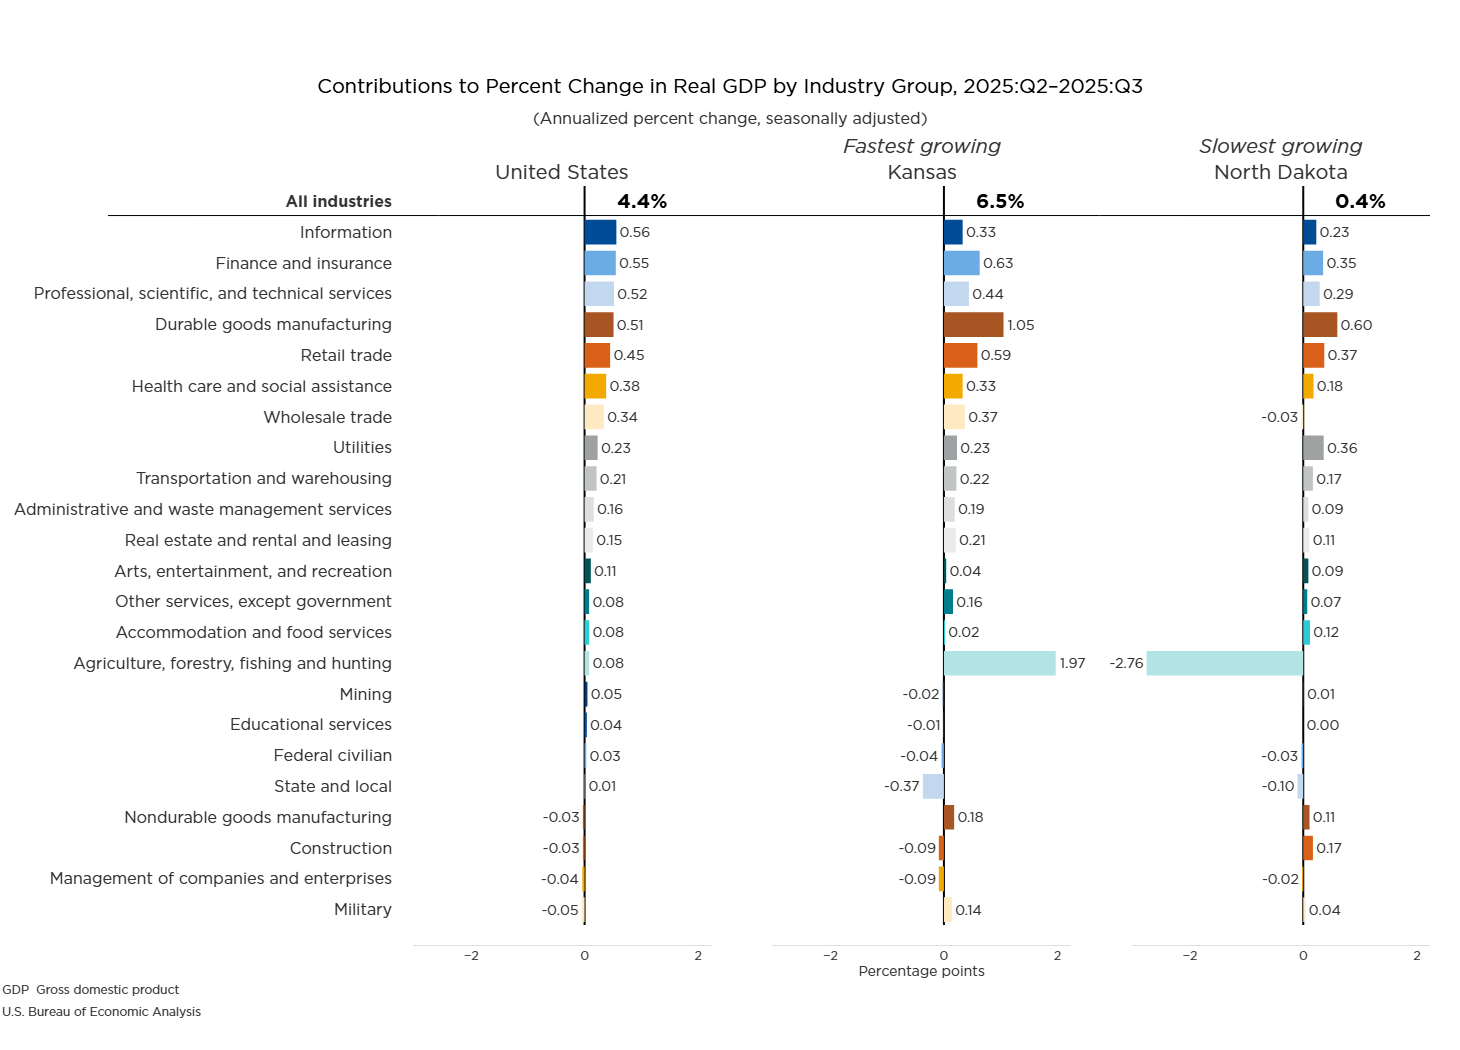
The headline figure from the BEA’s report is the robust growth in real GDP, which climbed at an impressive annual rate of 4.4 percent nationwide. This figure signifies a healthy expansion of the nation’s total output of goods and services, adjusted for inflation. The growth was not confined to a select few regions; every state and the District of Columbia experienced an increase in real GDP during the third quarter.
The geographical distribution of this growth highlights a remarkable uniformity. While the national average stood at 4.4 percent, individual states exhibited a wide range of performance. Kansas emerged as a standout performer, with its real GDP accelerating at an annual rate of 6.5 percent. This exceptional growth suggests a particularly dynamic economic environment within the Sunflower State during this period. Conversely, North Dakota registered the slowest growth among the states, with its real GDP increasing at a rate of 0.4 percent. This disparity underscores the varied economic engines and sector-specific dynamics at play across the nation.
The BEA’s analysis further breaks down this growth by industry. In the third quarter of 2025, real GDP increased in 19 of the 23 industry groups for which the agency prepares quarterly state estimates. This broad-based sectoral growth indicates a healthy economic ecosystem, with multiple drivers contributing to the overall expansion. The information sector, finance and insurance, and professional, scientific, and technical services were identified as the leading contributors to the nation’s real GDP growth. These sectors, often characterized by innovation, knowledge-based activities, and essential financial services, played a pivotal role in bolstering the national economic output. Their leading contribution was observed in nearly half of the states, underscoring their widespread impact. Additionally, durable-goods manufacturing also demonstrated a notable impact on real GDP growth in several states, suggesting a resurgence or sustained strength in this vital sector.

Beyond real GDP, which accounts for inflation, current-dollar GDP—a measure of economic output at current prices—also demonstrated widespread increases. Nationally, current-dollar GDP grew at an annual rate of 8.3 percent. This figure is higher than the real GDP growth rate, indicating that price increases, or inflation, also played a role in the nominal value of economic output during the quarter. Kansas again led the pack in current-dollar GDP growth, with a remarkable 10.5 percent annual increase, followed by other states that also saw significant nominal gains. North Dakota, at the lower end of the spectrum, recorded a 2.6 percent increase in current-dollar GDP.
Personal Income: A Boost for Households
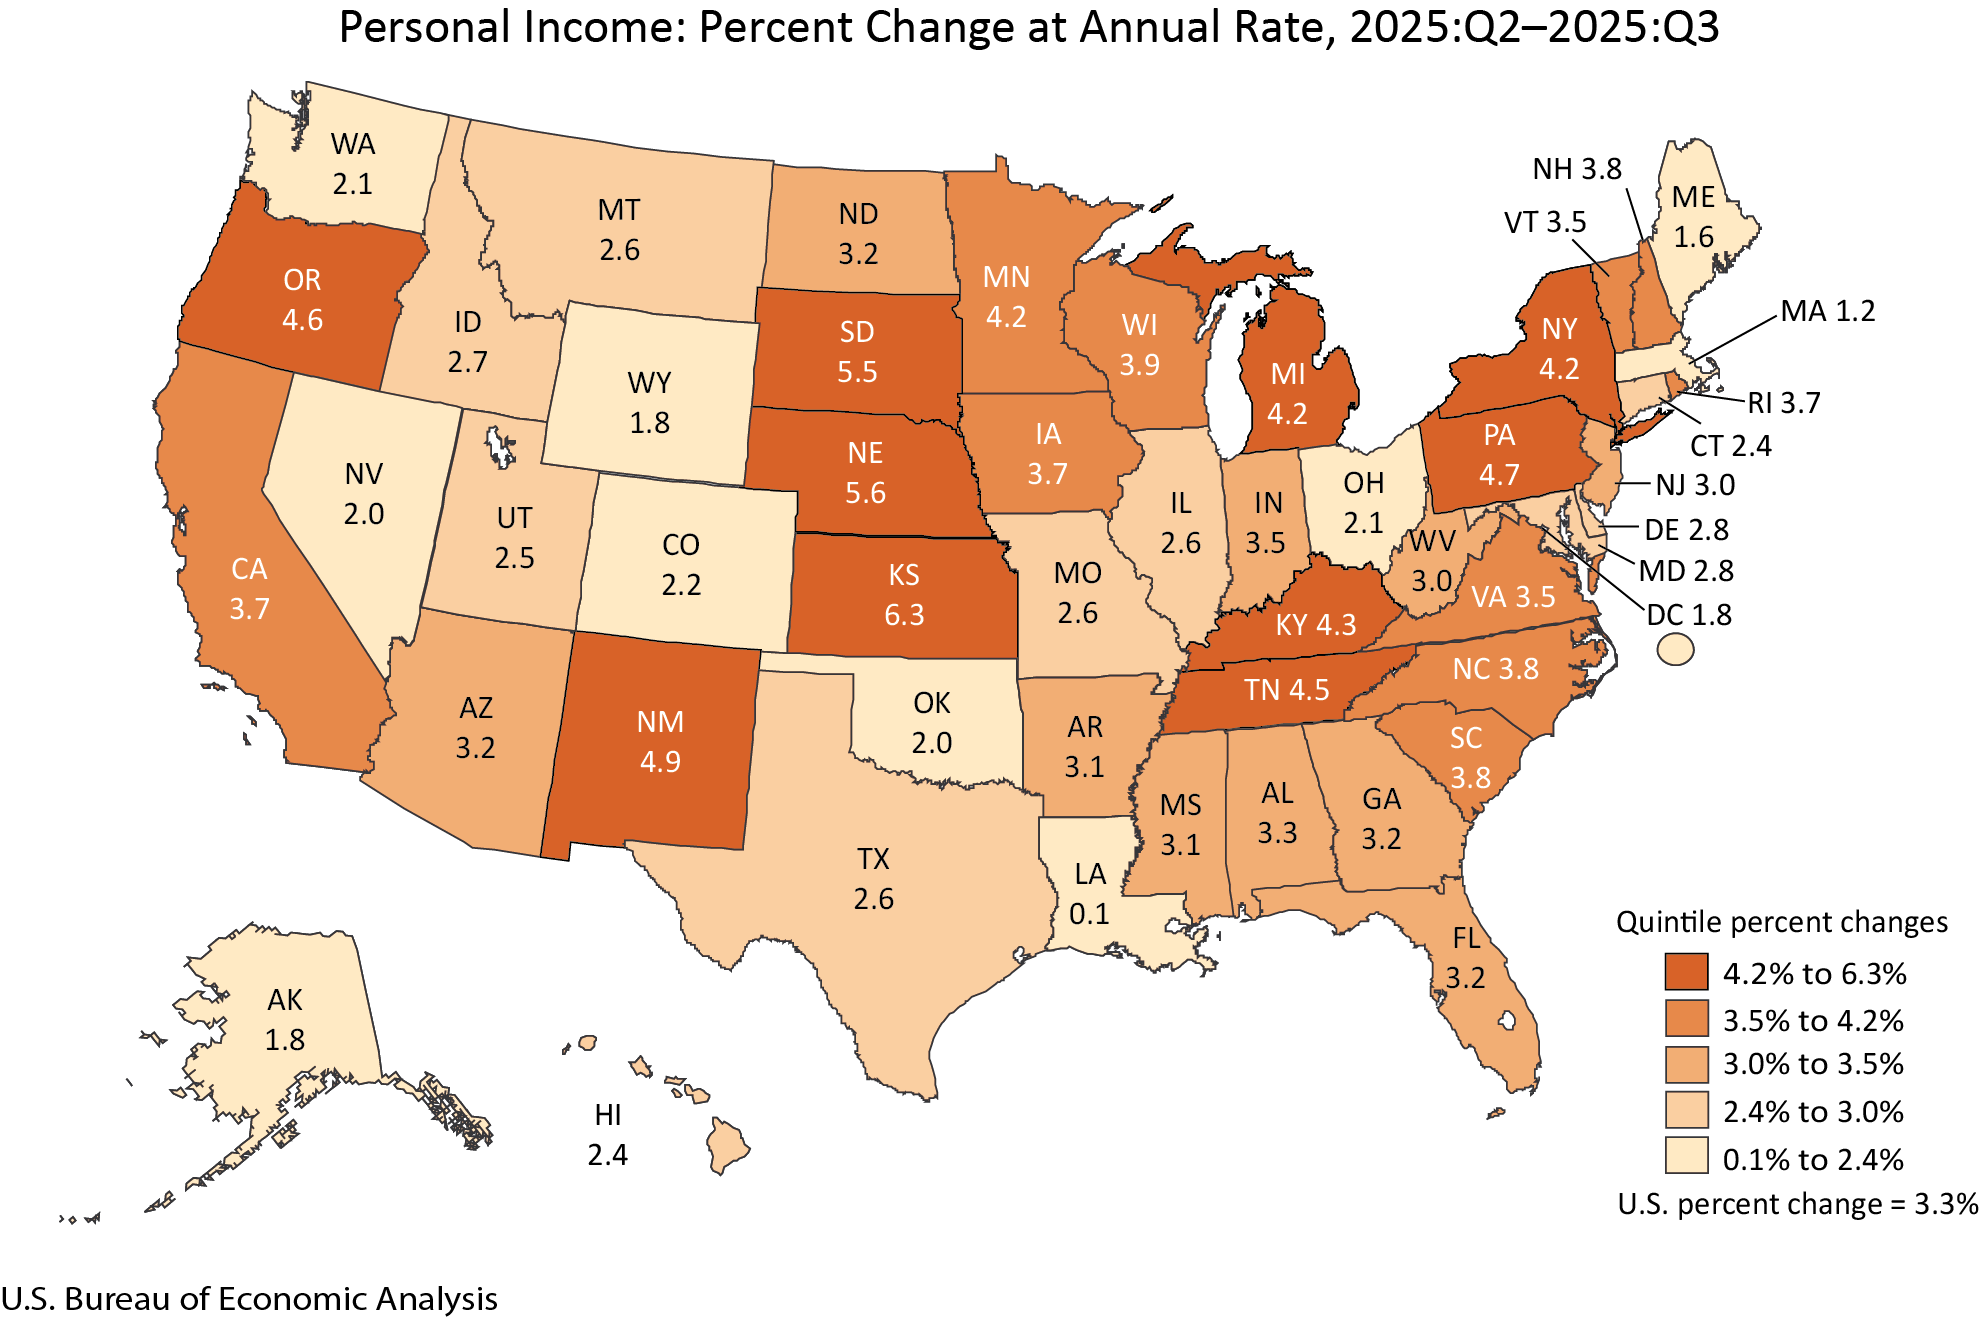
Complementing the strong GDP figures, personal income also saw a broad-based increase across all 50 states and the District of Columbia in the third quarter of 2025. Current-dollar personal income, representing the income received by households and institutions, rose at an annual rate of 3.3 percent nationwide. This increase signifies that households, on average, experienced a rise in their earnings and other income sources during the July-September period.
The distribution of personal income growth, similar to GDP, exhibited variation among states. Kansas once again stood out, with its personal income surging at an annual rate of 6.3 percent, reflecting strong economic activity and potentially higher wage growth within the state. On the other end of the spectrum, Louisiana recorded the slowest personal income growth at 0.1 percent. While this figure is modest, it still represents an increase, aligning with the national trend of income gains.
A crucial aspect of the personal income report is the breakdown of its components. The BEA confirmed that all major components of personal income—earnings, transfer receipts, and property income (which includes dividends, interest, and rent)—contributed to the overall increase in personal income nationally. Notably, earnings, which represent income from labor and proprietors’ activities, increased in all 50 states and the District of Columbia. This broad-based growth in earnings is a particularly positive sign, indicating widespread employment gains and potentially rising wages across the country. The consistent increase in earnings across all jurisdictions suggests a healthy labor market and robust economic activity supporting wage growth.
Updates and Revisions: A Sharpened Economic Picture
In addition to the third-quarter estimates, the BEA also released revised quarterly estimates for personal income by state for the first and second quarters of 2025. These revisions are a standard part of the BEA’s statistical process, incorporating new and revised source data that become available over time. This continuous refinement process ensures that the reported economic figures are as accurate and comprehensive as possible, aligning state-level data with updated national estimates from the National Income and Product Accounts. The latest revisions are particularly important as they reflect the most current understanding of economic performance leading into the third quarter.
Furthermore, the BEA provided new estimates for per capita personal income for the third quarter of 2025, along with revised estimates for the first and second quarters. Per capita personal income, calculated by dividing total personal income by the U.S. Census Bureau’s population figures, offers a measure of the average income received by each person in a given area. The release of these figures, incorporating the latest population estimates, provides a more precise understanding of the economic well-being of individuals within each state.
Evolving Data Presentation: A Move Towards Integration
In a significant shift in how economic data is disseminated, the BEA announced a new combined national and state news release format, scheduled to begin on April 9, 2026. Starting with the release of fourth-quarter 2025 and preliminary annual 2025 statistics, national and state economic data will be presented concurrently. This integration will encompass GDP, GDP by industry, corporate profits, and state estimates of GDP and personal income. This consolidated approach aims to provide a more holistic and cohesive view of the nation’s economic performance, enabling users to more readily connect national trends with state-level realities. The current practice of releasing these datasets on separate days will be discontinued, streamlining the information flow for researchers, policymakers, and the public.
Accompanying this change in release schedule are recent modifications in the presentation of data tables. Previously embedded within the quarterly news releases, these tables are now exclusively available through BEA’s Interactive Data Application. This digital platform offers enhanced functionality, allowing users to customize data queries, access full historical time series, and download data in various formats, including PDFs, Excel, and CSV. While this transition may require users to adapt to a new access point, it is intended to improve efficiency and provide a more robust and flexible data exploration experience. The BEA emphasizes that these interactive tables are the most complete and up-to-date source for its regional economic data.
Analytical Context and Implications
The widespread economic growth observed in the third quarter of 2025 suggests a period of sustained economic expansion, characterized by healthy demand, increasing production, and rising incomes. The fact that all states experienced GDP growth, coupled with the broad-based increase in personal income and earnings, points to a generally favorable economic climate.
The outperformance of states like Kansas, and the generally strong growth across many regions, can be attributed to a combination of factors that likely include strong consumer spending, robust business investment, and potentially favorable commodity prices or sector-specific booms. The leading contributions from information, finance, and professional services indicate the continued importance of the knowledge-based economy in driving national growth. The resurgence or continued strength in durable-goods manufacturing in certain states suggests a diversification of economic drivers and a potential re-shoring or strengthening of domestic production capabilities.
The consistent increase in earnings across all states is a particularly encouraging sign for household financial well-being. It suggests that the benefits of economic growth are being broadly shared, which can lead to increased consumer confidence and further fuel economic activity. However, the variation in growth rates among states also highlights the persistent regional economic disparities that continue to be a focus for policymakers. Understanding the specific drivers behind the leading and lagging states will be crucial for targeted economic development strategies.
The BEA’s ongoing efforts to refine its data collection and presentation methods, including the move to integrated national and state releases and the enhanced Interactive Data Application, reflect a commitment to providing timely, accurate, and user-friendly economic information. These changes are designed to empower a wider range of stakeholders with the tools to analyze and understand the complex dynamics of the U.S. economy.
Looking Ahead: Future Economic Indicators and Release Schedule
The BEA’s next major release, scheduled for April 9, 2026, at 8:30 a.m. EDT, will provide the third estimate of U.S. GDP, along with data on industries, corporate profits, and the comprehensive state-level GDP and personal income statistics for the fourth quarter and the full year of 2025. This forthcoming release will offer a more complete picture of the nation’s economic trajectory throughout 2025, integrating preliminary annual data with the final quarterly estimates.
For detailed statistical definitions, conventions, and regional breakdowns, users are directed to the BEA’s "Additional Information" resources. The availability of historical data within the BEA’s Data Archive will allow for long-term trend analysis once the third-quarter data is superseded by future releases. The consistent reporting of these key economic indicators by the BEA remains a cornerstone for economic analysis and policy formulation in the United States.