


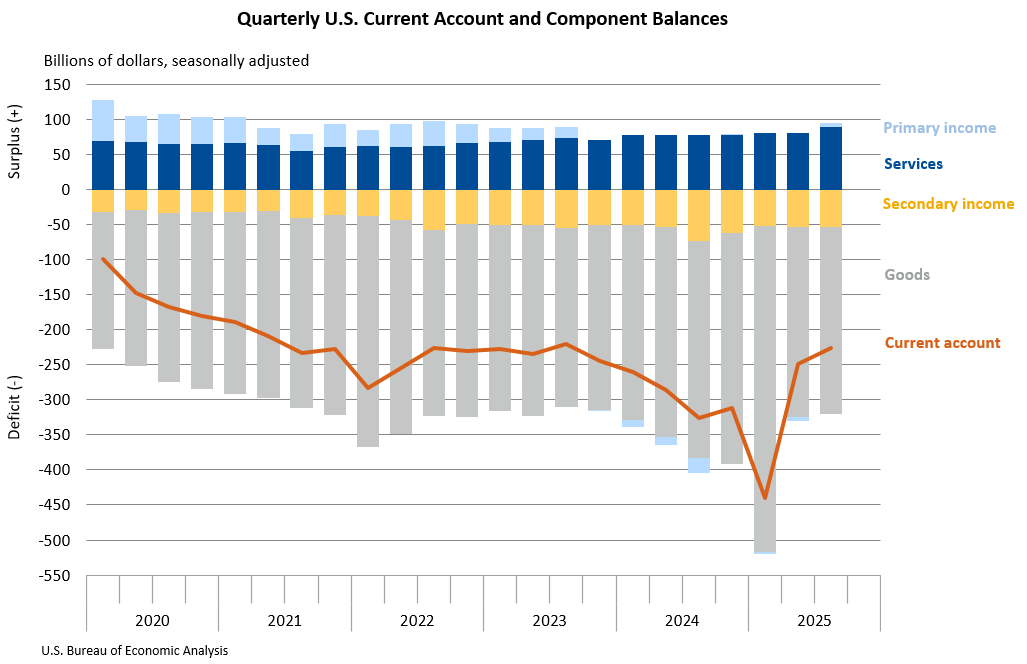
The U.S. current-account deficit, a comprehensive measure of a nation’s transactions with the rest of the world encompassing trade in goods and services, as well as income flows, experienced a substantial reduction in the third quarter of 2025. The deficit narrowed by $22.8 billion, or 9.2 percent, to $226.4 billion, down from a revised $249.2 billion in the second quarter, according to data released by the U.S. Bureau of Economic Analysis (BEA). This improvement marks a positive development for the U.S. economy, bringing the deficit down to 2.9 percent of current-dollar gross domestic product (GDP) from 3.3 percent in the preceding quarter.
The significant contraction in the current-account deficit was primarily fueled by a notable shift in the balance on primary income, which moved from a deficit in the second quarter to a surplus in the third. This turnaround, coupled with an expanded surplus in services trade and a reduced deficit in goods trade, contributed to the overall improvement. This multifaceted improvement suggests a more balanced economic engagement with the global community during the period.
Key Drivers of the Deficit Reduction
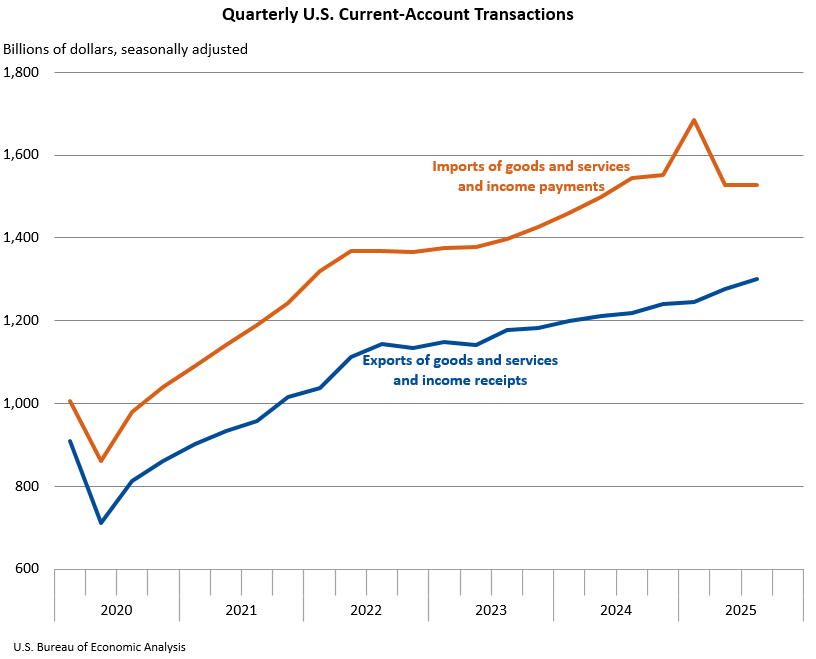
The BEA’s detailed breakdown of current-account transactions reveals a dynamic interplay of factors contributing to the narrowing deficit. Overall, exports of goods and services, along with income received from foreign residents, saw an increase of $24.1 billion, reaching a total of $1.30 trillion. Conversely, imports of goods and services, and income paid to foreign residents, also rose, albeit at a much slower pace of $1.3 billion, totaling $1.53 trillion. This disparity in growth rates between exports and imports was instrumental in shrinking the overall deficit.
Trade in Goods: A Mixed Picture
Within the realm of goods trade, the deficit saw a reduction. Exports of goods declined by $1.9 billion to $548.0 billion. This decrease was largely attributed to a fall in nonmonetary gold transactions, which was partially counterbalanced by increases in exports of capital goods and consumer goods. Simultaneously, imports of goods decreased by $5.0 billion to $815.4 billion. This reduction was primarily driven by a decline in imported consumer goods, which was largely offset by a notable increase in imports of nonmonetary gold. The BEA’s clarification on "nonmonetary gold" as distinct from monetary gold reserves is crucial for understanding these movements, as it often reflects investment flows or industrial demand rather than official reserves.
Services Trade Surges
The services sector emerged as a significant contributor to the improved current-account balance. Exports of services experienced a robust increase of $11.7 billion, reaching $314.2 billion. Imports of services also grew, but at a slower pace of $3.1 billion, totaling $225.0 billion. The surge in both services exports and imports was predominantly led by the "other business services" category, which includes professional and management consulting services. This indicates a strong demand for U.S. expertise and services abroad, while also reflecting increased engagement with international service providers. The surplus in services trade widened considerably, providing a crucial offset to the deficit in goods.
Primary Income Rebounds
Perhaps the most impactful development was the turnaround in the primary income balance. Receipts of primary income, which represent earnings generated by U.S. residents from their investments abroad, increased by $16.3 billion to $395.2 billion. This broad-based increase spanned all major categories, with direct investment income leading the way. Concurrently, payments of primary income, or earnings paid to foreign residents on their investments in the U.S., increased by $5.3 billion to $390.0 billion. This rise was mainly due to an increase in "other investment income," primarily interest on loans and deposits. The shift from a primary income deficit to a surplus underscores a more favorable return on U.S. foreign assets compared to foreign assets held in the U.S. during the quarter.
Secondary Income Stabilizes
The secondary income balance, which comprises current transfers like remittances and foreign aid, saw a modest decrease. Receipts of secondary income declined by $2.0 billion to $44.4 billion, attributed to a reduction in private transfers. Payments of secondary income also decreased by $2.1 billion to $97.9 billion, primarily due to a decline in general government transfers. While not a major driver of the overall deficit reduction, the slight contraction in secondary income flows had a minor dampening effect.
Capital and Financial Account Dynamics
Beyond the current account, the BEA also reported on capital and financial account transactions. The capital account, which tracks non-financial asset transfers and debt forgiveness, saw an increase in capital-transfer receipts by $164 million to $181 million. However, capital-transfer payments decreased significantly by $659 million to $1.3 billion.
The financial account, which records transactions involving financial assets and liabilities, indicated a net outflow of capital from the U.S. Net financial-account transactions were negative $409.9 billion in the third quarter, signifying net U.S. borrowing from foreign residents. This reflects the flip side of the current-account deficit: a nation that is a net importer of goods and services typically needs to finance this through borrowing or selling assets.
Financial Assets and Liabilities
U.S. residents’ foreign financial assets increased by $403.4 billion in the third quarter. This increase was broadly distributed, with "other investment assets" growing by $224.4 billion, direct investment assets by $91.9 billion, and portfolio investment assets by $86.2 billion. Reserve assets also saw a marginal increase of $0.9 billion.
Conversely, U.S. liabilities to foreign residents increased substantially by $797.2 billion. Portfolio investment liabilities saw the largest jump, rising by $486.8 billion. "Other investment liabilities" increased by $195.9 billion, and direct investment liabilities grew by $114.6 billion. This dynamic highlights a significant increase in foreign investment into U.S. assets, particularly in portfolio and other investment categories.
Net transactions in financial derivatives were negative $16.1 billion, also reflecting net U.S. borrowing from foreign residents.
Revisions to Second-Quarter Data
The BEA also provided updated figures for the second quarter of 2025. The preliminary estimate for the current-account deficit was revised from $251.3 billion to $249.2 billion, a slight improvement. The goods balance was revised to a deficit of $270.4 billion from $270.0 billion. The services balance was revised upward to a surplus of $80.6 billion from $79.6 billion. The primary income balance saw a slight improvement to a deficit of $5.8 billion from $7.7 billion. The secondary income balance was revised to a deficit of $53.6 billion from $53.2 billion.
Net financial-account transactions for the second quarter were revised to a deficit of $396.7 billion from a preliminary estimate of $406.9 billion. These revisions underscore the dynamic nature of economic data and the importance of updated figures for accurate analysis.
Broader Context and Future Outlook
The narrowing of the U.S. current-account deficit in the third quarter of 2025 can be viewed within the broader context of global economic trends and U.S. economic policy. A persistent current-account deficit can raise concerns about a nation’s long-term debt sustainability and its reliance on foreign capital. However, a deficit is not inherently negative, especially if it reflects robust investment in productive assets that will generate future returns.
The positive performance in services trade, particularly in professional and management services, aligns with the U.S.’s strength in the knowledge-based economy. The rebound in primary income suggests that U.S. investments abroad are performing well, contributing positively to national income.
Looking ahead, the BEA announced significant changes to its publication schedule and format. Beginning in March 2026, quarterly U.S. international transactions and international investment position accounts will be published in a single, combined news release. This consolidation aims to provide a more comprehensive view of the U.S. in the global economy and accelerate the availability of international investment position statistics. Furthermore, the detailed tables currently embedded within the news releases will be replaced by dynamic links to the BEA’s Interactive Data Application. This modernization effort is designed to improve data accessibility and user experience, allowing for more flexible data exploration and downloading in various formats.
The next release, scheduled for March 25, 2026, at 8:30 a.m. EDT, will cover the 4th Quarter and Year 2025. This upcoming release will be the first under the new combined format, offering a comprehensive overview of the U.S. international economic engagement for the entire year. Subsequent releases in 2026 will include the 1st Quarter 2026 and Annual Update (June 24), the 2nd Quarter 2026 (September 24), and the 3rd Quarter 2026 (December 18). These upcoming releases will be closely watched by economists, policymakers, and investors for continued insights into the trajectory of the U.S. current-account balance and its implications for the global economic landscape. The BEA’s commitment to modernizing its data dissemination reflects a broader trend towards greater transparency and accessibility in economic statistics.


