


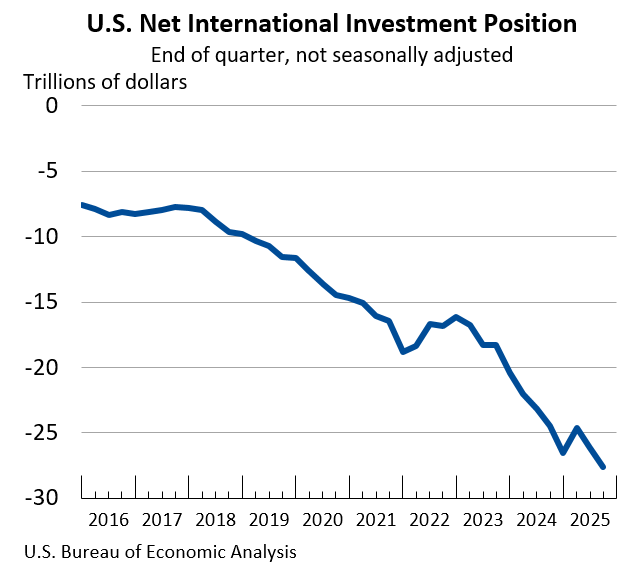
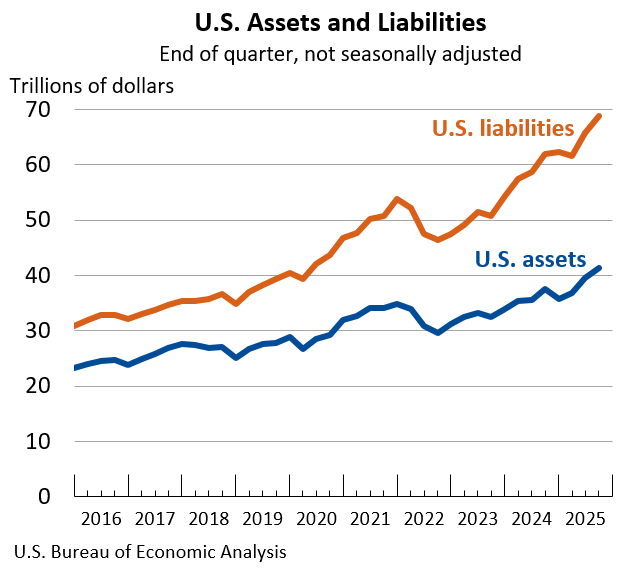
The United States’ net international investment position, a critical measure of the nation’s financial relationship with the rest of the world, registered a significant deficit of negative $27.61 trillion at the close of the third quarter of 2025. This figure, released by the U.S. Bureau of Economic Analysis (BEA), reflects a widening gap between the value of foreign financial assets owned by U.S. residents and the value of U.S. financial liabilities owed to foreign residents. The total value of U.S. assets held abroad stood at $41.27 trillion, while U.S. liabilities to foreign entities reached $68.89 trillion. This represents a downward revision from the preliminary estimate of negative $26.16 trillion for the second quarter of 2025.
Widening Deficit Driven by Market Fluctuations
The substantial $1.46 trillion deterioration in the net investment position from the second to the third quarter of 2025 was not solely attributable to financial transactions. Instead, a considerable portion of this shift, specifically negative $1.07 trillion, was driven by "other changes in position," a category encompassing fluctuations in asset and liability values due to price and exchange-rate movements. Net financial transactions, which represent the actual flow of investments into and out of the U.S., contributed a negative $386.1 billion to the overall change.
A key driver behind these valuation changes was the differential performance of U.S. and foreign stock markets. The BEA noted that price changes accounted for a negative $1.06 trillion. This was primarily due to U.S. stock price increases outpacing those in foreign markets. While this might seem positive for domestic investors, it had the effect of increasing the market value of U.S. liabilities (assets held by foreigners in the U.S.) more significantly than the market value of U.S. assets held abroad. Essentially, the rising value of American companies and securities made them more attractive to foreign investors, thereby increasing the U.S.’s overall debt to the rest of the world in nominal terms, even as the underlying economic activity grew.
U.S. Assets Show Robust Growth, Outpaced by Liabilities
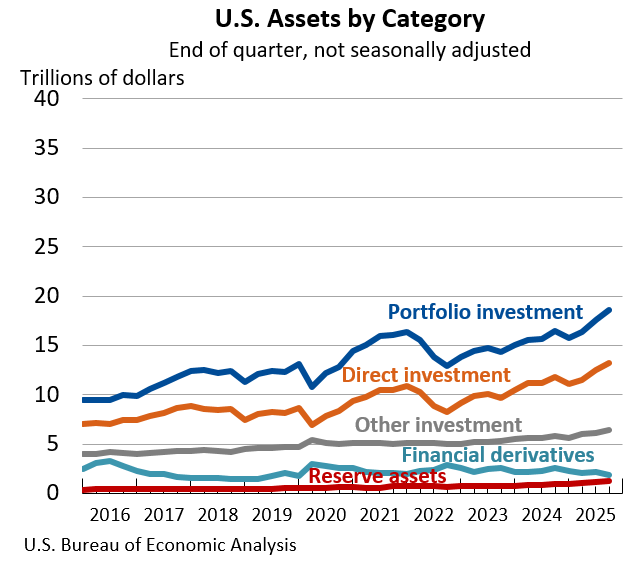
Despite the widening net deficit, the value of U.S. assets held internationally experienced a healthy increase. At the end of the third quarter of 2025, U.S. assets abroad climbed by $1.71 trillion to a total of $41.27 trillion. This growth was largely propelled by the appreciation of foreign equity markets, which boosted the market value of U.S. portfolio investment assets by $863.0 billion and U.S. direct investment assets abroad by $609.4 billion. Portfolio investment includes holdings of foreign stocks and bonds, while direct investment refers to ownership or control of 10% or more of a foreign enterprise. With the exception of financial derivatives, all major categories of U.S. assets held internationally saw an increase in their market value during the quarter.
However, the growth in U.S. liabilities to foreign entities was even more pronounced. Total U.S. liabilities surged by $3.17 trillion to reach $68.89 trillion by the end of the third quarter. This substantial increase was predominantly driven by the rising valuations of U.S. equities and debt securities held by foreign investors. The market value of foreign-held portfolio investment in the U.S. increased by $1.39 trillion, and the value of foreign direct investment in the U.S. rose by $1.20 trillion.
Furthermore, financial transactions played a significant role in the accumulation of U.S. liabilities. Net financial inflows amounted to $797.8 billion, largely reflecting strong foreign purchases of U.S. equity and long-term debt securities. This indicates continued international confidence in the U.S. economy and its investment opportunities, even as the overall net investment position widened. Similar to assets, most categories of U.S. liabilities, excluding financial derivatives, experienced an increase during the quarter.
Revisions to Second-Quarter Data
The BEA also provided revised estimates for the second quarter of 2025, indicating minor adjustments to previously reported figures. The preliminary estimate for the U.S. net international investment position at the end of the second quarter was negative $26.14 trillion. This has been revised to negative $26.16 trillion. U.S. assets remained unchanged at $39.56 trillion, while U.S. liabilities saw a slight upward revision from $65.71 trillion to $65.72 trillion. These revisions underscore the dynamic nature of international investment data and the importance of ongoing statistical adjustments.
Context and Historical Perspective
The negative net international investment position is not a new phenomenon for the United States. It has been in negative territory for decades, reflecting a historical pattern of the U.S. being a net borrower from the rest of the world. This has often been attributed to the U.S. dollar’s status as the world’s primary reserve currency, making dollar-denominated assets attractive to foreign investors, and the historical role of the U.S. as a destination for global capital seeking investment opportunities.
However, the sheer magnitude of the deficit, now exceeding $27 trillion, raises questions about the long-term sustainability of this trend and its potential implications for U.S. economic policy and global financial stability. A persistently large negative net international investment position can, in theory, make a country more vulnerable to external economic shocks, as a significant portion of its assets are foreign-owned and a substantial amount of its income is paid out to foreign creditors.
BEA’s Data Modernization Initiatives
In a related announcement, the BEA highlighted upcoming changes to its publication schedule and data presentation for international accounts. Beginning in March 2026, the quarterly U.S. international transactions and international investment position accounts will be consolidated into a single news release. This initiative aims to provide a more comprehensive view of the U.S. engagement with the global economy and will accelerate the availability of international investment position statistics.
Furthermore, as part of its ongoing modernization efforts, the BEA will transition from including detailed tables within the news release body to providing dynamic links to its Interactive Data Application. This shift is intended to reduce duplication, enhance efficiency, and direct users to more complete and flexible data tables. These customizable tables will offer full time series data and will be downloadable in various formats, including PDF, Excel, and CSV. This move is expected to improve data accessibility and user experience for researchers, analysts, and the general public.
Implications and Future Outlook
The widening U.S. net international investment deficit, driven by market valuations rather than a surge in net borrowing, suggests a complex interplay of global economic forces. While the U.S. economy continues to attract significant foreign investment, the rising value of these investments, coupled with the performance of U.S. equities, has amplified the nation’s liabilities on paper.
Economists will be closely monitoring several factors moving forward. The trajectory of U.S. and global stock markets will continue to heavily influence the net investment position. Additionally, shifts in exchange rates could play a significant role, as changes in the value of the U.S. dollar relative to other currencies can alter the dollar value of foreign assets and liabilities. The BEA’s upcoming releases will be crucial for understanding the evolving dynamics of the U.S. international financial standing.
The next release from the BEA, scheduled for March 25, 2026, at 8:30 a.m. EDT, will cover the U.S. International Transactions and Investment Position for the fourth quarter and the full year of 2025. This release will provide further insights into the trends observed in the third quarter and will set the stage for the comprehensive data to be presented under the new combined release format in 2026. The BEA has also outlined its release schedule for the remainder of 2026, with subsequent releases planned for June 24, September 24, and December 18, covering the first, second, and third quarters of 2026, respectively. These regular updates are vital for policymakers, businesses, and investors to navigate the complexities of the global financial landscape.


