Lana Rhoades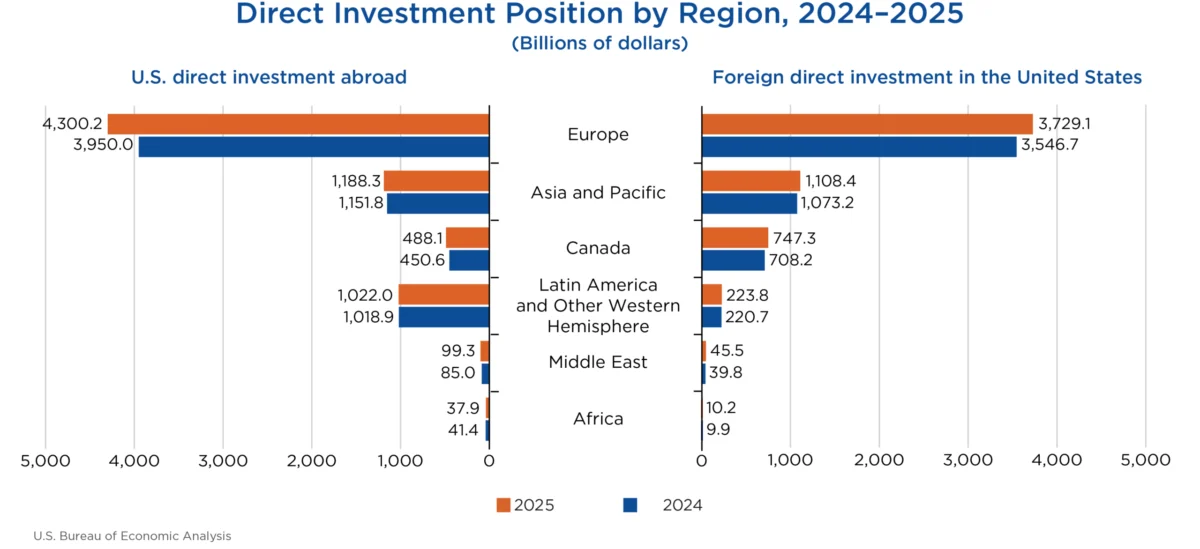
The cumulative level of U.S. direct investment abroad surged by $438.1 billion to reach a new high of $7.14 trillion by the end of 2025. This substantial increase, as detailed in statistics recently released by the U.S. Bureau of Economic Analysis (BEA), was predominantly driven by a $350.2 billion expansion in investment within Europe, with the United Kingdom and Luxembourg emerging as key destinations. On the other side of the ledger, foreign direct investment (FDI) in the United States also experienced robust growth, climbing $266.0 billion to $5.86 trillion. This inflow was also significantly influenced by European investment, accounting for a $182.4 billion increase. These figures underscore the dynamic and interconnected nature of global capital flows and the United States’ pivotal role within them.
A Snapshot of Global Investment Trends in 2025
The BEA’s annual report on direct investment positions provides a comprehensive overview of the stock of foreign direct investment held by U.S. entities abroad and by foreign entities within the United States. These positions represent the cumulative value of direct investments, which are defined as an ownership interest of 10 percent or more in a foreign enterprise or a U.S. enterprise by an unaffiliated person resident in another country. The data released today covers the fiscal year ending December 31, 2025, and offers crucial insights into the economic strategies of multinational enterprises (MNEs) and the health of international investment relations.
The overall increase in U.S. direct investment abroad signals a continued appetite for international expansion among American corporations. This outward flow of capital can be attributed to a variety of factors, including the pursuit of new markets, access to specialized labor or resources, strategic acquisitions, and the desire to diversify operations geographically. The substantial growth in Europe, particularly in financial hubs like Luxembourg and the business-friendly environment of the United Kingdom, suggests that U.S. firms are capitalizing on opportunities within the continent.
Conversely, the significant increase in foreign direct investment into the United States indicates a sustained confidence in the American economy and its long-term growth prospects. This inward investment fuels domestic job creation, fosters innovation through the introduction of new technologies and management practices, and contributes to the overall economic output of the nation. The strong showing from Europe in attracting this investment highlights the continued appeal of the U.S. market to global businesses.
Deep Dive into U.S. Direct Investment Abroad
The $7.14 trillion U.S. direct investment abroad position at the close of 2025 represents a significant accumulation of assets by U.S. entities in foreign countries. The $438.1 billion increase from the previous year marks a strong upward trend, reflecting a robust global economic climate that encourages cross-border capital deployment.
Key Drivers of Outward Investment:
- Geographic Concentration: Europe remained the primary destination for U.S. direct investment, contributing a substantial $350.2 billion to the overall increase. Within Europe, the United Kingdom and Luxembourg were particularly prominent. The United Kingdom, with its deep financial markets and strong legal framework, continues to be a favored location for U.S. companies seeking to establish or expand their European presence. Luxembourg, a global financial center, attracts significant investment through its holding company structures and its role in facilitating cross-border financial operations.
- Industry Focus: Manufacturing sector saw the most significant growth in U.S. direct investment abroad, spearheaded by advancements and expansion within chemical manufacturing. This suggests a strategic push by U.S. chemical companies to enhance their global production capabilities, secure supply chains, or access burgeoning international markets for their products.
- Top Host Countries: While U.S. multinational enterprises (MNEs) invest in a wide array of countries, their direct investment abroad in 2025 was notably concentrated. Over half of the total U.S. direct investment abroad was located in five key countries: the United Kingdom ($1,114.7 billion), the Netherlands ($1,044.0 billion), Luxembourg ($645.3 billion), Ireland ($511.9 billion), and Canada ($488.1 billion). This concentration underscores the importance of established economic partnerships and favorable investment climates in these nations.
- Affiliate Industry Breakdown: By industry of the directly owned foreign affiliate, holding companies accounted for the largest share of the overall U.S. direct investment position abroad in 2025, representing 45.8 percent. This reflects the complex organizational structures of many multinational corporations, where holding companies serve as central entities for managing diverse global operations and assets. Manufacturing affiliates followed, comprising 15.9 percent of the total, with finance and insurance affiliates ranking third at 13.5 percent.
- Parent Company Industry Breakdown: When viewed from the perspective of the U.S. parent companies, MNEs engaged in manufacturing accounted for the largest portion of outward investment, at 50.2 percent of the total position. This is followed by MNEs in the finance and insurance sector, which represented 15.8 percent of U.S. direct investment abroad. This highlights the dominant role of manufacturing industries in driving the U.S. outward investment strategy.
- Income Generation: U.S. MNEs generated substantial income from their cumulative investments abroad, earning $660.1 billion in 2025. This represents an 11.1 percent increase compared to 2024, signaling a healthy return on foreign assets. Income growth was particularly strong in holding companies, which saw an increase of $40.0 billion. However, income in the finance and insurance sector experienced a decline of $6.3 billion compared to the previous year, indicating potential shifts in market conditions or investment performance within that specific industry.
Examining Foreign Direct Investment in the United States
The $5.86 trillion position of foreign direct investment in the United States at the end of 2025 reflects the significant attraction of the U.S. economy to international capital. The $266.0 billion increase from 2024 underscores the continued global appeal of the American market for foreign businesses.
Key Drivers of Inward Investment:
- European Dominance: Similar to outward investment, Europe played a crucial role in driving FDI into the U.S., contributing a substantial $182.4 billion to the overall increase. This highlights strong transatlantic investment ties and the continued attractiveness of the U.S. market for European corporations.
- Key Investing Nations (by Foreign Parent): The United States welcomed significant investment from various countries. By country of foreign parent, Japan led the pack with a direct investment position of $776.3 billion. The Netherlands followed closely with $751.8 billion, with Canada ($747.3 billion) and the United Kingdom ($738.3 billion) also ranking as major sources of FDI. These figures demonstrate the broad international interest in U.S. assets and operations.
- Ultimate Beneficial Owner (UBO) Perspective: When investment is analyzed by the country of the ultimate beneficial owner (UBO), the landscape shifts slightly, offering a more nuanced view of the origin of capital. On this basis, Japan remained the top investing country with $827.1 billion, followed by Canada ($819.8 billion) and Germany ($706.2 billion). Notably, the UBO analysis revealed that investment originating from the Netherlands and Luxembourg was considerably lower than when viewed by the country of foreign parent. This suggests that a significant portion of investment channeled through these countries ultimately stems from investors in other nations, illustrating the role of these locations as financial intermediaries.
- Industry Concentration: The U.S. manufacturing sector was the primary recipient of foreign direct investment, accounting for a significant 42.8 percent of the total position, amounting to $2.51 trillion. Within this broad sector, chemical manufacturing was particularly strong, representing one-third of the total manufacturing investment, or $835.9 billion. This indicates a robust foreign interest in U.S. manufacturing capabilities, especially in the chemical industry, which may be driven by advanced technology, skilled labor, or market demand. Significant investments were also made in the finance and insurance sectors ($629.7 billion) and wholesale trade ($534.0 billion), underscoring the diverse opportunities available to foreign investors in the U.S. economy.
- Income Generated by Foreign Investors: Foreign MNEs earned $310.1 billion in income from their cumulative investments in the United States in 2025. This figure represents a modest 1.9 percent decrease compared to 2024, suggesting a slight recalibration of returns for foreign investors, potentially influenced by market fluctuations or industry-specific performance.
Revisiting Past Data and Future Outlook
The BEA’s release also includes revisions to previously published statistics for 2022, 2023, and 2024. These revisions are a standard part of the statistical process, incorporating newly available and revised source data to ensure the accuracy and reliability of economic reporting. For instance, foreign direct investment in the United States for 2022 saw a revision from $5,124 billion to $5,110 billion, and for 2023 from $5,376 billion to $5,338 billion. Similarly, U.S. direct investment abroad for 2023 was revised from $6,620 billion to $6,598 billion, and for 2024 from $6,827 billion to $6,698 billion. These adjustments highlight the dynamic nature of economic data and the BEA’s commitment to providing the most up-to-date information.
The BEA’s commitment to data transparency and accessibility is evident in the provision of extensive related data tables. These tables allow for detailed exploration of direct investment positions by country and industry, offering granular insights into specific investment flows and their underlying components. This comprehensive data allows economists, policymakers, and businesses to conduct in-depth analyses of global economic trends and their implications.
The next release from the BEA concerning direct investment is anticipated in July 2027, which will provide updated statistics for Direct Investment by Country and Industry for 2026. This forward-looking schedule ensures continuous monitoring and reporting of these vital economic indicators.
Broader Implications and Economic Significance
The reported growth in both outward U.S. direct investment and inward FDI into the United States signifies a healthy and interconnected global economy. For the United States, sustained FDI inflows are crucial for economic growth, job creation, and technological advancement. The substantial investments in manufacturing, particularly in chemicals and electrical equipment, suggest a strengthening of the U.S. industrial base, potentially leading to increased domestic production and competitiveness.
On the outward investment front, U.S. companies’ continued expansion abroad can lead to increased global market share, enhanced operational efficiencies, and greater access to diverse talent pools. The strong performance of U.S. investments abroad also contributes to the repatriation of profits, bolstering the U.S. economy.
The data also underscores the geopolitical and economic significance of key trading partners. The strong investment ties with European nations, Canada, and Japan highlight the enduring importance of these relationships for both U.S. and global economic stability. Understanding the flow of capital, especially through the lens of ultimate beneficial owners, provides a more accurate picture of the true origins and destinations of investment, offering valuable insights for trade policy and economic strategy.
The BEA’s ongoing efforts to refine its data collection and reporting methods, including the implementation of new disclosure avoidance techniques, are essential for providing the public with the most comprehensive and confidential data possible. This commitment ensures that policymakers and the business community can make informed decisions based on accurate and timely economic intelligence. The continued growth in direct investment positions, both inward and outward, signals a dynamic and evolving global economic landscape, with the United States remaining a central player in international capital flows.