


The U.S. Bureau of Economic Analysis (BEA) today released its comprehensive third-quarter 2025 statistics for gross domestic product (GDP) and personal income across all 50 states and the District of Columbia, painting a picture of widespread economic expansion. The data, covering the period of July, August, and September 2025, reveals a robust national economic performance, with every state experiencing an increase in real GDP. This broad-based growth, coupled with a healthy rise in personal income nationwide, underscores a dynamic economic environment during the third quarter.
National Economic Landscape: A Unified Surge in GDP
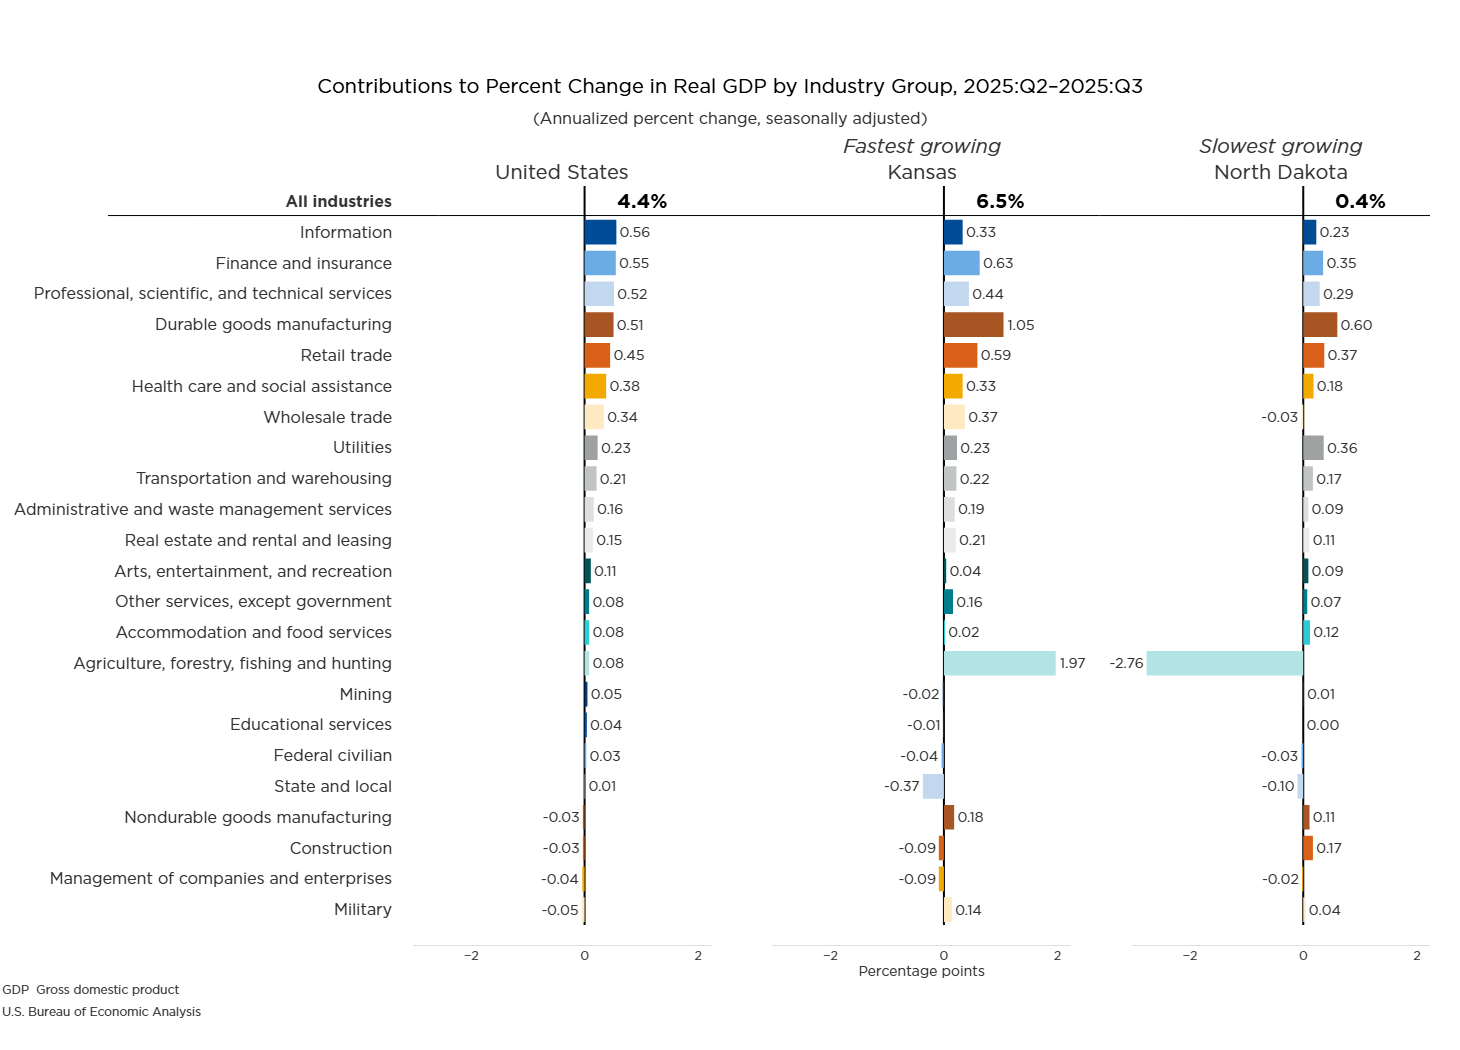
A key highlight of the BEA’s report is the universal growth in real GDP, a measure of economic output adjusted for inflation. All 50 states and the District of Columbia recorded positive real GDP growth in the third quarter of 2025. Nationally, real GDP surged at an impressive annual rate of 4.4 percent. This national figure, however, masks significant regional variations, with Kansas leading the pack with a remarkable annual growth rate of 6.5 percent. Conversely, North Dakota experienced the slowest growth among the states, registering 0.4 percent.
The breadth of this economic expansion suggests a healthy and resilient national economy, with most regions participating in the upward trend. This widespread growth is a positive indicator for businesses and consumers alike, signaling increased economic activity and potential for further investment and job creation. The variance in growth rates, while present, does not detract from the overarching theme of broad-based improvement.
Industry Contributions to Economic Expansion
Delving deeper into the drivers of this GDP growth, the BEA identified 19 of the 23 industry groups for which it prepares quarterly state estimates as contributors to the increase in real GDP. Several sectors stood out as particularly influential at the national level. The information sector, finance and insurance, and professional, scientific, and technical services were identified as leading contributors to the nation’s overall GDP growth. These industries, often characterized by innovation, knowledge-based services, and financial intermediation, appear to be at the forefront of the current economic expansion.
Furthermore, these dynamic sectors were significant drivers of real GDP growth in nearly half of all U.S. states. This suggests a national trend where sectors reliant on technology, expertise, and financial flows are fueling economic development across diverse geographical areas. Durable-goods manufacturing also played a notable role, impacting real GDP growth in several states, indicating a continued importance of the manufacturing sector in specific regional economies.

The outperformance of these knowledge-intensive and service-oriented industries aligns with broader economic trends observed in recent years, where the service sector has become an increasingly dominant force in developed economies. The strong performance of finance and insurance points to a stable and active financial market, while the growth in professional, scientific, and technical services suggests robust demand for specialized expertise and innovation.
Current-Dollar GDP: A Broader Measure of Economic Value
In addition to real GDP, the BEA also reported on current-dollar GDP, which reflects nominal economic output without adjusting for inflation. This measure also showed universal growth, with all 50 states and the District of Columbia experiencing an increase. Nationally, current-dollar GDP grew at an annual rate of 8.3 percent. Kansas again demonstrated exceptional performance, with a growth rate of 10.5 percent, while North Dakota recorded the lowest growth at 2.6 percent.
The higher growth rate in current-dollar GDP compared to real GDP indicates that a portion of the economic expansion is attributable to price increases. While real GDP provides a clearer picture of actual output volume, current-dollar GDP reflects the total value of goods and services produced, including any inflationary pressures. The fact that both measures show widespread growth is a testament to the broad economic momentum experienced across the nation.
Personal Income: A Positive Trend for Households
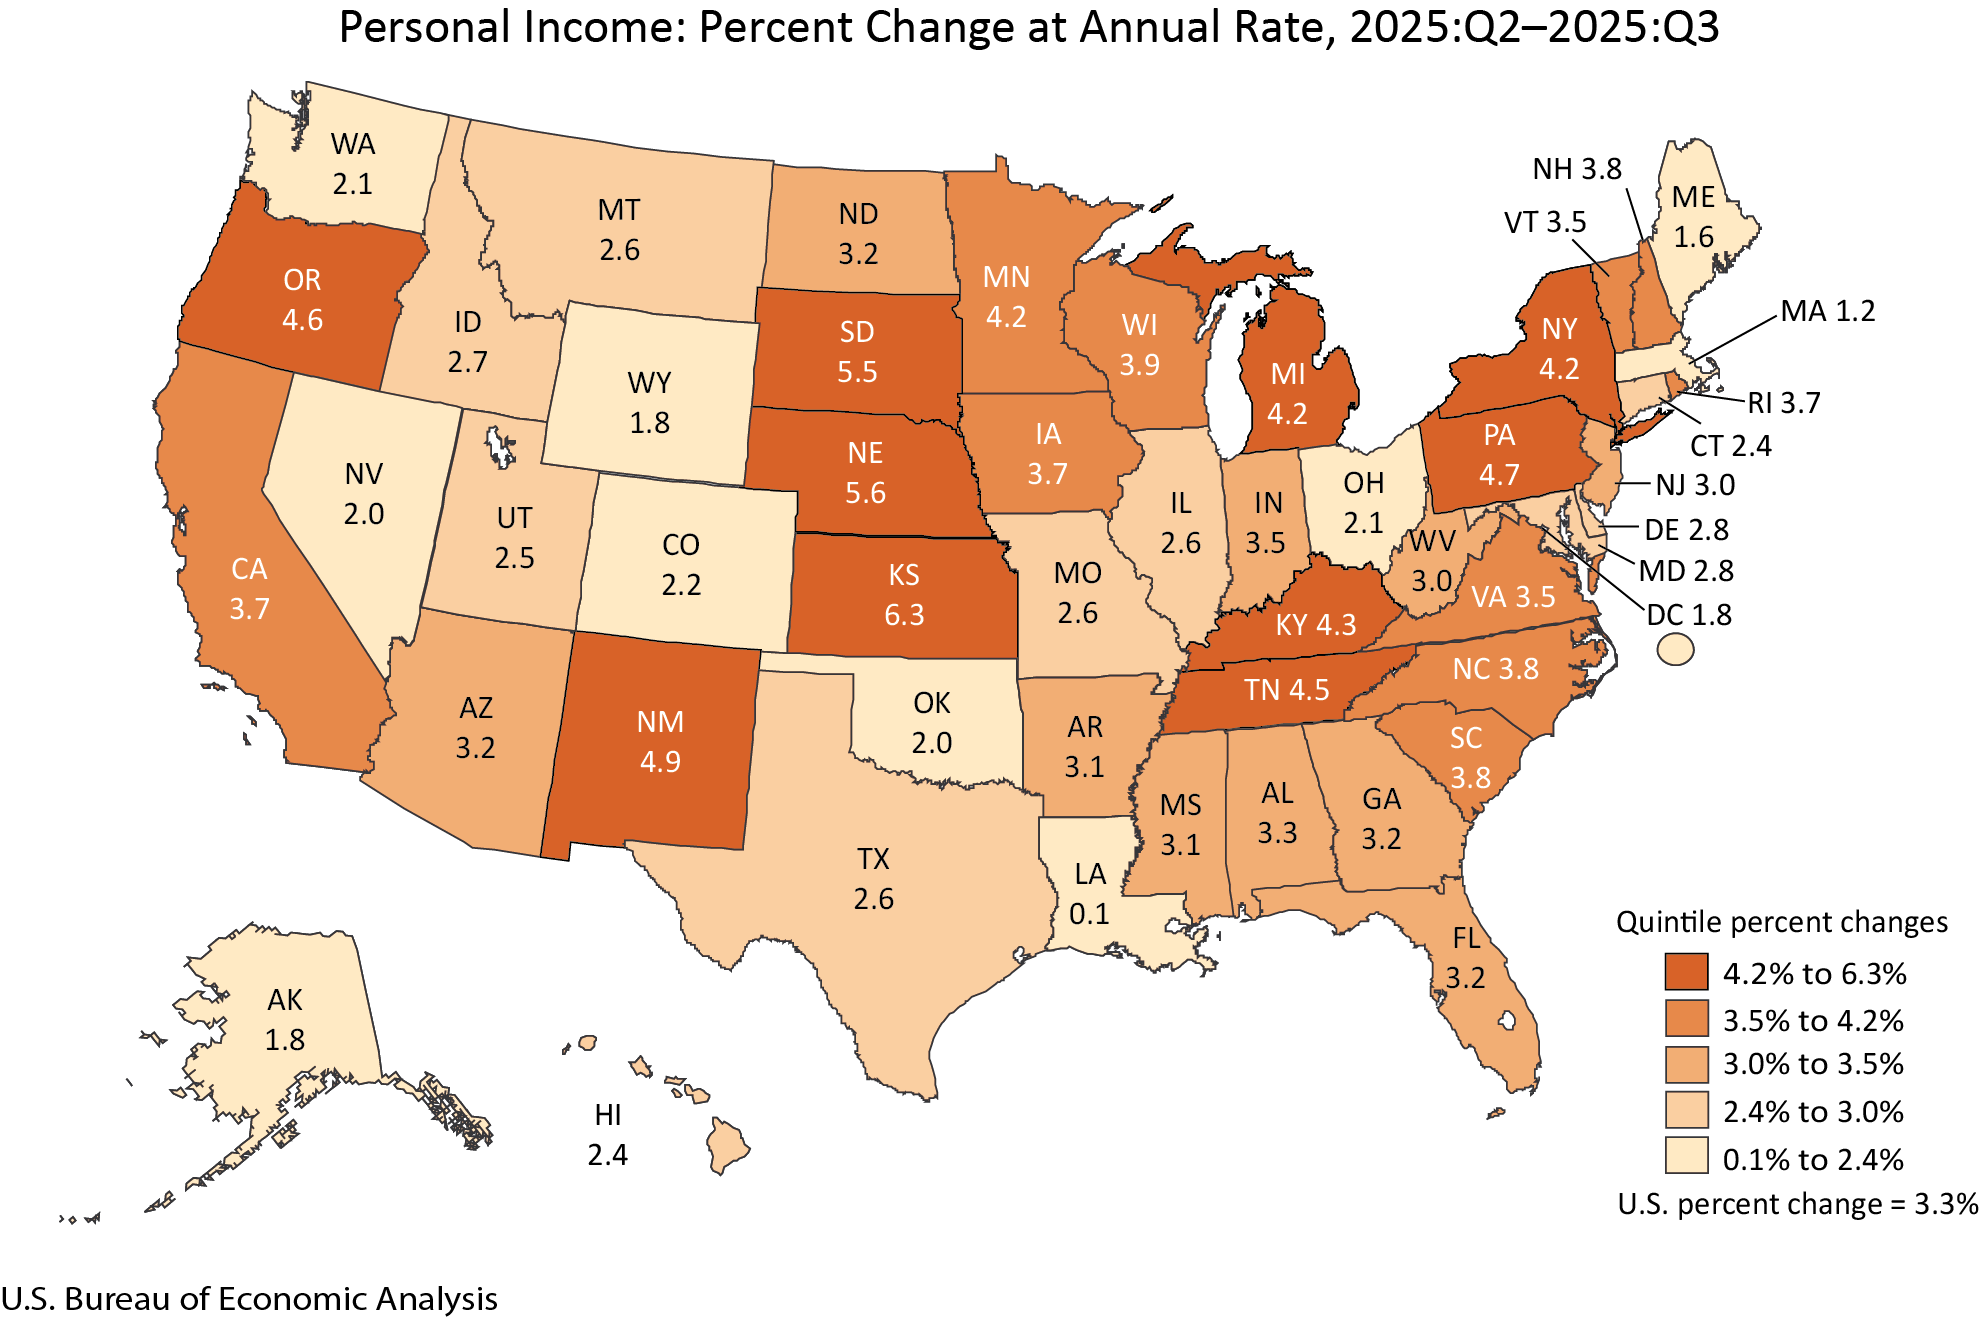
Beyond the aggregate measures of economic production, the BEA’s report also detailed trends in personal income, a crucial indicator of household financial well-being. Personal income, which includes earnings, transfer receipts, and property income, increased in all 50 states and the District of Columbia during the third quarter of 2025. This widespread rise in personal income is a significant positive development, suggesting that individuals and families across the country are experiencing an improvement in their financial circumstances.
Nationally, current-dollar personal income grew at an annual rate of 3.3 percent. Similar to GDP trends, Kansas led in personal income growth with a robust 6.3 percent increase. Louisiana, on the other hand, saw the slowest growth in personal income, with a rate of 0.1 percent.
The BEA highlighted that all components of personal income – earnings, transfer receipts, and property income (dividends, interest, and rent) – contributed to the national increase. Earnings, which represent income from labor and proprietor’s activities, saw growth in all 50 states and the District of Columbia. This broad-based increase in earnings is a particularly encouraging sign, as it reflects stronger wage growth and employment opportunities across the country. The contributions from transfer receipts and property income further bolster household incomes, indicating a multifaceted support for personal financial gains.
Revisions and Updates: Refining Economic Data
In conjunction with the release of third-quarter 2025 statistics, the BEA also provided updated estimates for personal income by state for the first and second quarters of 2025. These revisions are a standard part of the economic data release cycle, incorporating new and more comprehensive source data. The updated figures allow for a more accurate reflection of economic activity and ensure alignment with national estimates from the National Income and Product Accounts, which were released on January 22, 2026.
The BEA also released new estimates for per capita personal income for the third quarter of 2025, along with revised figures for the preceding two quarters. Per capita personal income, calculated using U.S. Census Bureau population data, provides an average measure of income per person. These updated figures offer a more granular view of income distribution and economic well-being at the individual level.
Evolution of BEA Reporting: A Move Towards Integrated Releases
A significant development announced by the BEA pertains to the future presentation of its data. Starting April 9, 2026, the BEA will begin releasing national and state economic estimates concurrently. This new approach will consolidate information previously published in separate releases, offering a more holistic view of the U.S. economy.
On specific release cycles, the BEA will now present GDP, GDP by industry, and corporate profits alongside state-level GDP and personal income data. This integrated release strategy aims to provide users with a more comprehensive and streamlined understanding of economic conditions at both the national and sub-national levels. By eliminating separate release dates for these closely related datasets, the BEA intends to enhance efficiency and improve the accessibility of its vital economic information.
Modernized Data Presentation: Interactive Applications and Online Access
In line with its efforts to improve data accessibility and user experience, the BEA has also updated its presentation of statistical tables. Data that were previously embedded within the quarterly news releases are now exclusively available through the BEA’s online Interactive Data Application. This move away from including tables directly in the news release is designed to reduce redundancy, increase efficiency, and direct data users to the BEA’s most flexible and comprehensive data resources.
The Interactive Data Application allows users to customize tables, access full time series, and download data in various formats, including PDFs, Excel, and CSV. This modernization of data presentation underscores the BEA’s commitment to providing users with powerful tools for data analysis and research. Links within the news release now direct users to these online resources, ensuring they have immediate access to the most current and detailed datasets.
Implications and Broader Economic Context
The widespread growth in GDP and personal income observed in the third quarter of 2025 suggests a period of sustained economic expansion. The outperformance of information, finance, and professional services indicates a continued shift towards a knowledge-based economy, where innovation and expertise are key drivers of wealth creation. The resilience of durable-goods manufacturing in certain regions also highlights the ongoing importance of industrial sectors in bolstering local economies.
The increase in personal income across all states is a crucial indicator of consumer confidence and spending power. As households experience higher incomes, this can translate into increased demand for goods and services, further stimulating economic activity. The broad-based nature of this income growth suggests that the benefits of economic expansion are being more widely distributed, which is a positive sign for social and economic equity.
However, the variance in growth rates among states, while expected, also points to the diverse economic landscapes that exist within the United States. Factors such as industry concentration, labor force dynamics, and regional policy environments likely contribute to these differences. Understanding these variations is crucial for policymakers seeking to foster inclusive and balanced economic development across the nation.
The BEA’s announcement regarding integrated national and state data releases marks a significant step forward in how economic statistics are disseminated. This move is likely to be welcomed by economists, policymakers, and researchers who benefit from a consolidated view of economic performance. The emphasis on interactive online tools also reflects a broader trend towards digital access and user-centric data platforms.
As the U.S. economy continues to navigate evolving global and domestic challenges, data from sources like the BEA remain indispensable for informed decision-making. The third-quarter 2025 report provides a snapshot of a thriving economy, characterized by broad-based growth and rising incomes, setting a positive tone for the remainder of the year and offering valuable insights for future economic analysis. The next major release, scheduled for April 9, 2026, will offer a more complete picture of the fourth quarter and the entire year of 2025, providing further context for the ongoing economic narrative.


