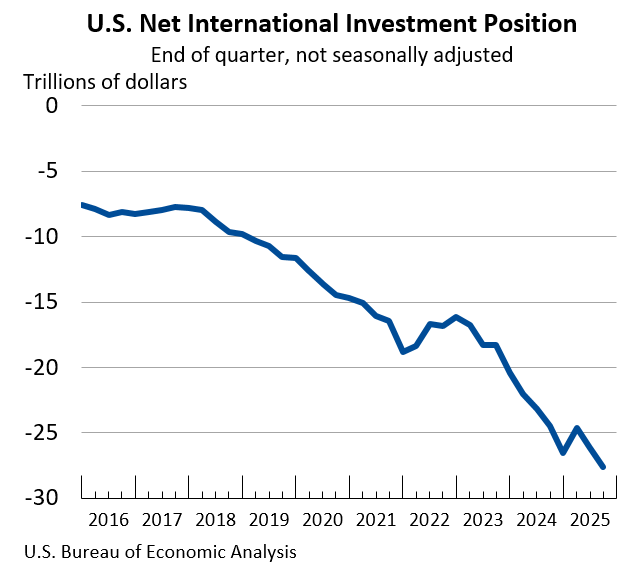
The United States recorded a significant widening of its net international investment position, reporting a deficit of $27.61 trillion at the close of the third quarter of 2025. This figure, released by the U.S. Bureau of Economic Analysis (BEA), reflects the difference between the value of financial assets owned by U.S. residents abroad and the value of foreign-held financial assets in the United States. The latest data shows U.S. foreign assets valued at $41.27 trillion, while U.S. liabilities to foreign entities stood at a considerably larger $68.89 trillion. This represents a deterioration from the revised net investment position of -$26.16 trillion at the end of the second quarter of 2025. The BEA’s detailed statistics, including breakdowns of assets and liabilities, are available in Table 1 of their official release.
The substantial $1.46 trillion negative swing in the net international investment position from the second to the third quarter was a result of two primary factors: net financial transactions and net other changes, which encompass fluctuations in asset prices and exchange rates. Net financial transactions contributed a negative $386.1 billion to the position. However, the more significant driver of the widening deficit was the net other changes, which amounted to a substantial -$1.07 trillion. These "other changes" are largely influenced by market valuations, and in this quarter, price changes alone accounted for a significant portion of this shift.
Market Valuations Drive Widening Deficit
The BEA report highlights that price changes exerted a considerable downward pressure on the net investment position, subtracting $1.06 trillion. This was primarily attributed to a dynamic in stock markets where the appreciation of U.S. equities outpaced that of foreign equities. While this might initially sound like good news for U.S. holdings, the reporting mechanism for the international investment position means that a larger increase in the market value of U.S. liabilities (foreign holdings of U.S. assets) relative to the increase in U.S. assets abroad exacerbates the net deficit. In simpler terms, the value of what foreigners owned in the U.S. grew more rapidly than the value of what Americans owned abroad due to market performance.
Surge in U.S. Assets Driven by Equity Markets
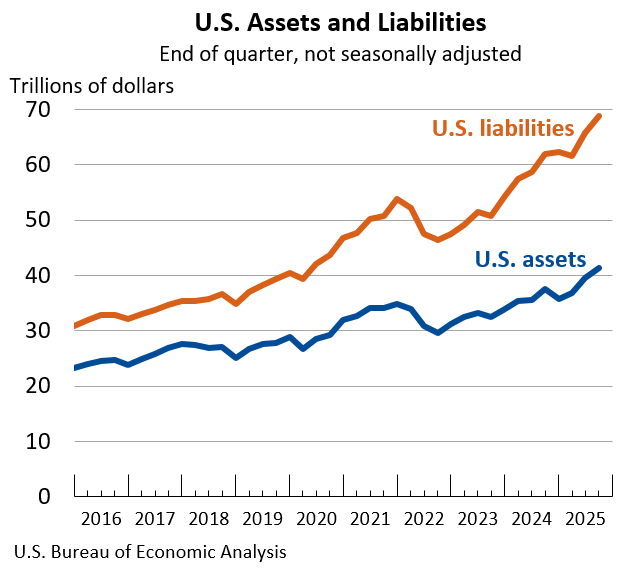
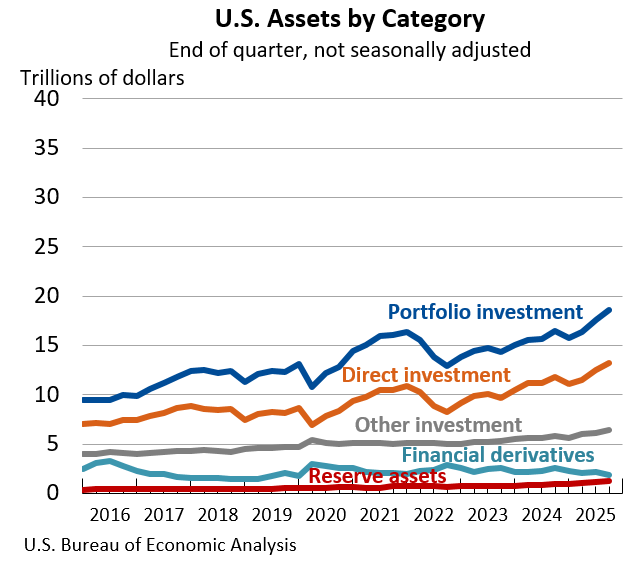
Despite the overall negative trend in the net position, the total value of U.S. assets held abroad experienced a notable increase, rising by $1.71 trillion to reach $41.27 trillion by the end of the third quarter. This growth was significantly fueled by the robust performance of global equity markets. Foreign stock price increases played a crucial role, boosting the market value of U.S. portfolio investment assets by $863.0 billion and U.S. direct investment assets by $609.4 billion, according to Table 2 of the BEA release. Portfolio investment assets include foreign stocks and bonds held by U.S. investors, while direct investment assets represent U.S. ownership of substantial stakes in foreign businesses. All major categories of U.S. assets, with the exception of financial derivatives, saw an increase in value during the third quarter, underscoring a broad-based positive valuation adjustment.
Liabilities Outpace Assets Amidst Strong Foreign Investment
Concurrently, U.S. liabilities to foreign entities surged by an even greater $3.17 trillion, reaching a total of $68.89 trillion by the end of the third quarter. This substantial increase was also heavily influenced by market valuations, particularly the strong performance of U.S. equities. The rising value of U.S. stocks led to a $1.39 trillion increase in the market value of portfolio investment liabilities and a $1.20 trillion increase in direct investment liabilities. This signifies that the value of foreign holdings in U.S. stocks and businesses appreciated significantly.
Beyond market valuation effects, financial transactions also played a role in the rise of U.S. liabilities. These transactions added $797.8 billion to the liability side, primarily driven by foreign purchases of U.S. equity and long-term debt securities. This indicates sustained foreign appetite for U.S. financial instruments. Similar to assets, all major categories of U.S. liabilities, excluding financial derivatives, experienced an increase in the third quarter.
Revisions to Second Quarter Data
The BEA also provided revised estimates for the second quarter of 2025, showing a slight adjustment to previously reported figures. The preliminary estimate for the U.S. net international investment position at the end of the second quarter was -$26.14 trillion. This has been revised to -$26.16 trillion. U.S. assets remained unchanged at $39.56 trillion in the revised figures, while U.S. liabilities saw a marginal upward revision from $65.71 trillion to $65.72 trillion. These revisions, while small in percentage terms, provide a more accurate baseline for assessing subsequent quarterly movements.
BEA Modernization: Streamlining Data Releases
In related news from the Bureau of Economic Analysis, the agency announced significant changes to its publication schedule and format for international economic data. Beginning in March 2026, the quarterly U.S. international transactions and international investment position accounts will be consolidated into a single news release. This move aims to provide a more comprehensive overview of the U.S. engagement with the global economy and will accelerate the availability of international investment position statistics by replacing the current practice of issuing two separate releases on different dates.
Furthermore, as part of its ongoing modernization efforts, the BEA will transition away from including detailed tables within the body of its news releases. Instead, the combined release will feature dynamic links directing users to the BEA’s Interactive Data Application. This application offers a more flexible and complete data environment, allowing users to customize tables, access full time series, and download data in various formats, including PDF, Excel, and CSV. This shift is intended to reduce redundancy, enhance efficiency, and ensure data users have direct access to the most up-to-date and granular information.
Future Outlook and Data Availability
The next release of U.S. International Transactions and Investment Position data is scheduled for March 25, 2026, at 8:30 a.m. EDT, covering the fourth quarter and the full year of 2025. Subsequent releases in 2026 are planned for June 24 (First Quarter and Annual Update), September 24 (Second Quarter), and December 18 (Third Quarter). These regular updates are crucial for policymakers, economists, and investors to monitor the U.S. economy’s financial ties with the rest of the world and to understand the implications of global economic trends on national financial health. The increasing reliance on international capital flows for both investment and consumption means that the trajectory of the U.S. net international investment position remains a key indicator of economic stability and global financial integration. The widening deficit, driven by market forces in the third quarter, suggests continued reliance on foreign capital and underscores the importance of sustained economic growth and attractive investment opportunities within the United States to manage these liabilities effectively.